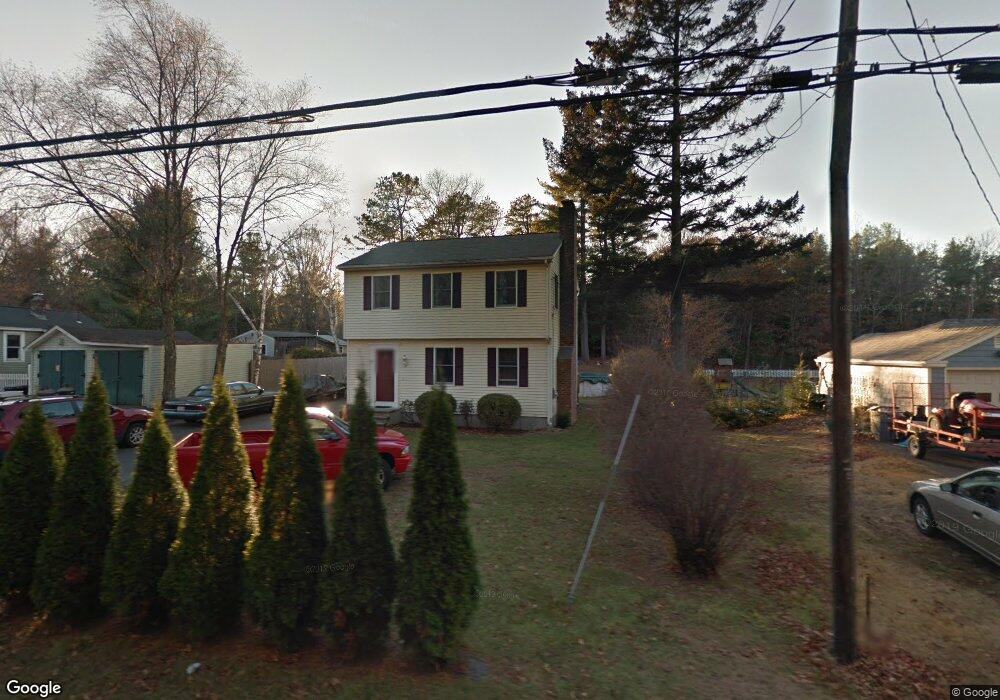
42 Strong St Easthampton, MA 01027
Estimated Value: $413,362 - $464,000
2
Beds
1
Bath
600
Sq Ft
$714/Sq Ft
Est. Value
About This Home
This home is located at 42 Strong St, Easthampton, MA 01027 and is currently estimated at $428,591, approximately $714 per square foot. 42 Strong St is a home located in Hampshire County with nearby schools including Easthampton High School, Hilltown Cooperative Charter Public School, and Calvary Baptist Christian School.
Ownership History
Date
Name
Owned For
Owner Type
Purchase Details
Closed on
Mar 22, 2019
Sold by
Shute Brian
Bought by
Shute Ft
Current Estimated Value
Purchase Details
Closed on
Aug 29, 1997
Sold by
Park Homes Inc
Bought by
Shute Brian M and Shute Jayna A
Home Financials for this Owner
Home Financials are based on the most recent Mortgage that was taken out on this home.
Original Mortgage
$112,000
Interest Rate
7.41%
Mortgage Type
Purchase Money Mortgage
Purchase Details
Closed on
Apr 8, 1997
Sold by
Est Markley Isablle and Zumbruski Alice
Bought by
Park Homes Inc
Create a Home Valuation Report for This Property
The Home Valuation Report is an in-depth analysis detailing your home's value as well as a comparison with similar homes in the area
Home Values in the Area
Average Home Value in this Area
Purchase History
| Date | Buyer | Sale Price | Title Company |
|---|---|---|---|
| Shute Ft | -- | -- | |
| Shute Brian M | $122,000 | -- | |
| Park Homes Inc | $25,500 | -- |
Source: Public Records
Mortgage History
| Date | Status | Borrower | Loan Amount |
|---|---|---|---|
| Previous Owner | Park Homes Inc | $112,000 | |
| Previous Owner | Park Homes Inc | $60,000 |
Source: Public Records
Tax History Compared to Growth
Tax History
| Year | Tax Paid | Tax Assessment Tax Assessment Total Assessment is a certain percentage of the fair market value that is determined by local assessors to be the total taxable value of land and additions on the property. | Land | Improvement |
|---|---|---|---|---|
| 2025 | $4,795 | $350,800 | $109,400 | $241,400 |
| 2024 | $4,625 | $341,100 | $106,300 | $234,800 |
| 2023 | $3,633 | $248,000 | $83,500 | $164,500 |
| 2022 | $4,099 | $248,000 | $83,500 | $164,500 |
| 2021 | $4,501 | $256,600 | $83,500 | $173,100 |
| 2020 | $4,404 | $248,000 | $83,500 | $164,500 |
| 2019 | $3,780 | $244,500 | $83,500 | $161,000 |
| 2018 | $3,642 | $227,600 | $78,800 | $148,800 |
| 2017 | $3,556 | $219,400 | $75,800 | $143,600 |
| 2016 | $3,420 | $219,400 | $75,800 | $143,600 |
| 2015 | $3,324 | $219,400 | $75,800 | $143,600 |
Source: Public Records
Map
Nearby Homes