42 Teak Loop Ocala, FL 34472
Silver Spring Shores NeighborhoodEstimated Value: $237,000 - $259,000
3
Beds
2
Baths
1,430
Sq Ft
$172/Sq Ft
Est. Value
About This Home
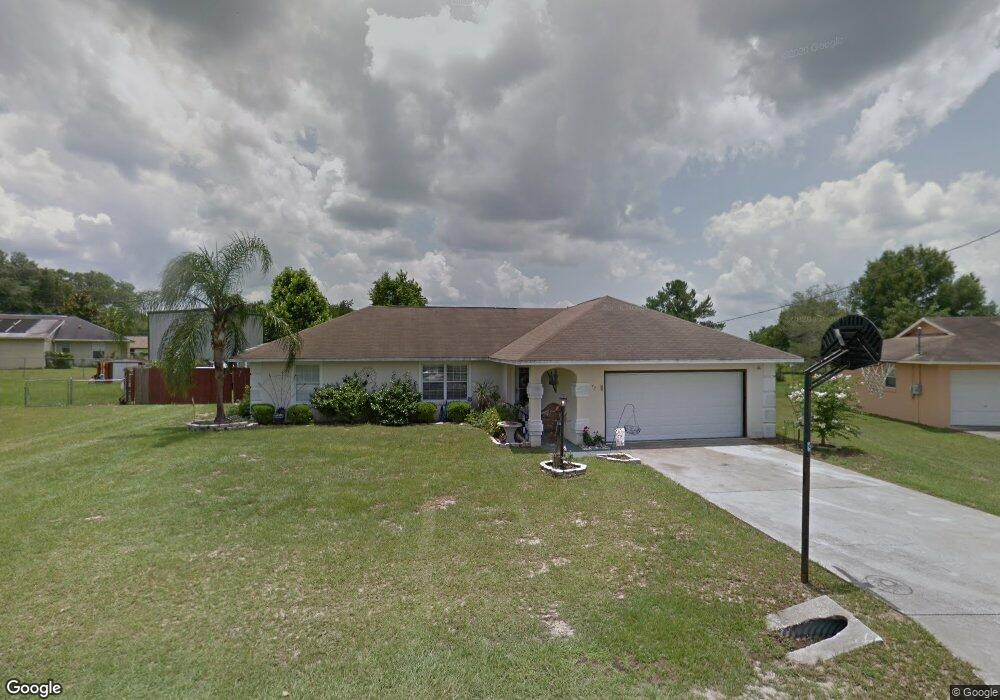
This home is located at 42 Teak Loop, Ocala, FL 34472 and is currently estimated at $246,233, approximately $172 per square foot. 42 Teak Loop is a home located in Marion County with nearby schools including Maplewood Elementary School, Fort King Middle School, and Forest High School.
Ownership History
Date
Name
Owned For
Owner Type
Purchase Details
Closed on
Nov 26, 2001
Sold by
Smith Stephen J
Bought by
Smith Catherine M
Current Estimated Value
Purchase Details
Closed on
Aug 28, 2000
Sold by
Frederick
Bought by
Smith Stephen J and Smith Catherine M
Home Financials for this Owner
Home Financials are based on the most recent Mortgage that was taken out on this home.
Original Mortgage
$74,500
Outstanding Balance
$25,923
Interest Rate
8.24%
Estimated Equity
$220,310
Create a Home Valuation Report for This Property
The Home Valuation Report is an in-depth analysis detailing your home's value as well as a comparison with similar homes in the area
Home Values in the Area
Average Home Value in this Area
Purchase History
| Date | Buyer | Sale Price | Title Company |
|---|---|---|---|
| Smith Catherine M | -- | -- | |
| Smith Stephen J | $84,500 | First American Title Ins Co |
Source: Public Records
Mortgage History
| Date | Status | Borrower | Loan Amount |
|---|---|---|---|
| Open | Smith Stephen J | $74,500 |
Source: Public Records
Tax History
| Year | Tax Paid | Tax Assessment Tax Assessment Total Assessment is a certain percentage of the fair market value that is determined by local assessors to be the total taxable value of land and additions on the property. | Land | Improvement |
|---|---|---|---|---|
| 2025 | $1,471 | $98,928 | -- | -- |
| 2024 | $1,235 | $96,140 | -- | -- |
| 2023 | $1,200 | $93,340 | $0 | $0 |
| 2022 | $1,162 | $90,621 | $0 | $0 |
| 2021 | $1,151 | $87,982 | $0 | $0 |
| 2020 | $1,139 | $86,767 | $0 | $0 |
| 2019 | $1,117 | $84,816 | $0 | $0 |
| 2018 | $1,065 | $83,235 | $0 | $0 |
| 2017 | $1,045 | $81,523 | $0 | $0 |
| 2016 | $922 | $73,873 | $0 | $0 |
| 2015 | $924 | $73,359 | $0 | $0 |
| 2014 | $878 | $72,777 | $0 | $0 |
Source: Public Records
Map
Nearby Homes
- 6 Almond Trace
- 0 Almond Trail Ct Unit MFROM713086
- 6 Teak Rd
- 6748 Cherry Rd
- 76 Teak Loop
- 6728 Cherry Rd
- 6 Almond Course
- 6762 Cherry Rd
- 6724 Cherry Rd
- 46 Teak Run
- 40 Teak Run
- 32 Almond Dr
- 1 Almond Pass
- 6303 La Costa Dr Unit 1079
- 4 Banyan Dr
- 1900 Jasper Place
- 1895 Jasper Place Unit 1376
- 6203 La Costa Dr
- 6095 La Costa Dr Unit 552
- 4 Teak Run
Your Personal Tour Guide
Ask me questions while you tour the home.