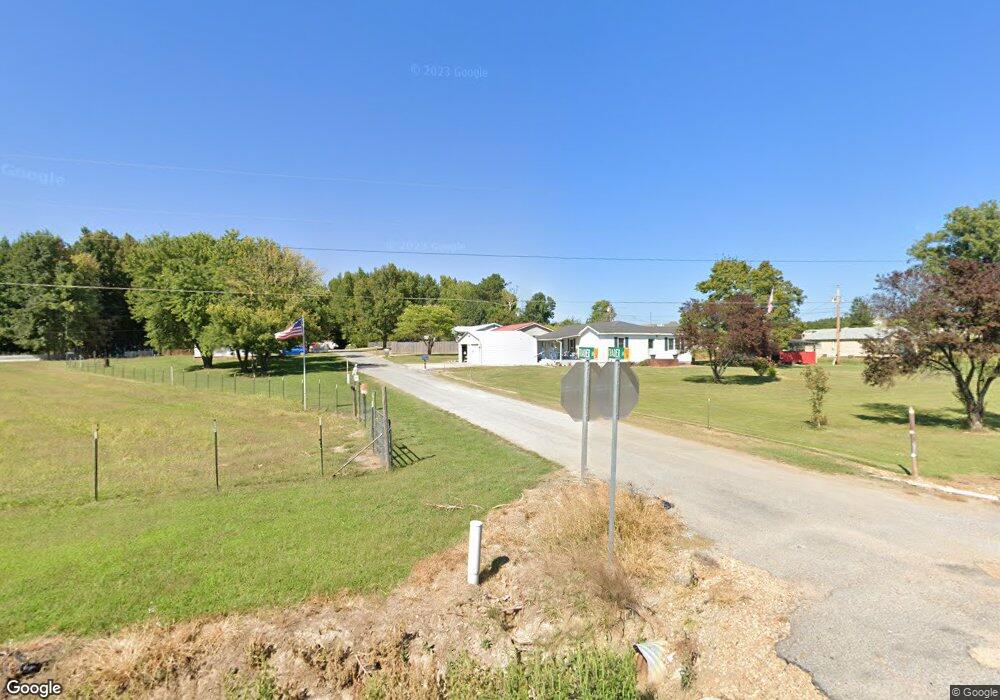
42 Trader Ln Ripley, TN 38063
Estimated Value: $71,000 - $88,000
--
Bed
1
Bath
768
Sq Ft
$102/Sq Ft
Est. Value
About This Home
This home is located at 42 Trader Ln, Ripley, TN 38063 and is currently estimated at $78,658, approximately $102 per square foot. 42 Trader Ln is a home located in Lauderdale County with nearby schools including Ripley Primary School, Ripley Elementary School, and Ripley Middle School.
Ownership History
Date
Name
Owned For
Owner Type
Purchase Details
Closed on
Oct 29, 2021
Sold by
Carver Jimmy Sherman
Bought by
Henderson Abigail Elisabeth
Current Estimated Value
Home Financials for this Owner
Home Financials are based on the most recent Mortgage that was taken out on this home.
Original Mortgage
$50,003
Outstanding Balance
$45,598
Interest Rate
2.8%
Mortgage Type
New Conventional
Estimated Equity
$33,060
Purchase Details
Closed on
Jan 27, 2015
Sold by
Carver Ricky Darell
Bought by
Carver Jimmy Sherman
Purchase Details
Closed on
Jul 11, 2013
Sold by
Carver Jimmy S
Bought by
Hargett Betty F
Purchase Details
Closed on
Aug 17, 2000
Sold by
Robert Shelton and Robert Catherine
Bought by
Carver Jimmy S
Purchase Details
Closed on
Apr 16, 1998
Sold by
Shelton C L C and Shelton Betty
Bought by
Robert Shelton and Robert Catherine
Purchase Details
Closed on
Apr 6, 1998
Bought by
Shelton Robert and Shelton Catherine
Purchase Details
Closed on
Dec 20, 1993
Bought by
Shelton Shelton C and Shelton Betty
Purchase Details
Closed on
Jul 5, 1984
Purchase Details
Closed on
Jun 7, 1984
Create a Home Valuation Report for This Property
The Home Valuation Report is an in-depth analysis detailing your home's value as well as a comparison with similar homes in the area
Home Values in the Area
Average Home Value in this Area
Purchase History
| Date | Buyer | Sale Price | Title Company |
|---|---|---|---|
| Henderson Abigail Elisabeth | $51,550 | None Available | |
| Carver Jimmy Sherman | -- | -- | |
| Hargett Betty F | -- | -- | |
| Carver Jimmy S | $15,000 | -- | |
| Robert Shelton | $12,688 | -- | |
| Shelton Robert | $12,700 | -- | |
| Shelton Shelton C | $13,000 | -- | |
| -- | -- | -- | |
| -- | -- | -- |
Source: Public Records
Mortgage History
| Date | Status | Borrower | Loan Amount |
|---|---|---|---|
| Open | Henderson Abigail Elisabeth | $50,003 |
Source: Public Records
Tax History Compared to Growth
Tax History
| Year | Tax Paid | Tax Assessment Tax Assessment Total Assessment is a certain percentage of the fair market value that is determined by local assessors to be the total taxable value of land and additions on the property. | Land | Improvement |
|---|---|---|---|---|
| 2025 | $288 | $11,350 | $0 | $0 |
| 2024 | $288 | $11,350 | $750 | $10,600 |
| 2023 | $288 | $11,350 | $750 | $10,600 |
| 2022 | $288 | $11,350 | $750 | $10,600 |
| 2021 | $102 | $11,350 | $750 | $10,600 |
| 2020 | $104 | $4,000 | $750 | $3,250 |
| 2019 | $100 | $3,525 | $575 | $2,950 |
| 2018 | $100 | $3,400 | $575 | $2,825 |
| 2017 | $101 | $3,400 | $575 | $2,825 |
| 2016 | $101 | $3,400 | $575 | $2,825 |
| 2015 | $123 | $3,400 | $575 | $2,825 |
| 2014 | $123 | $4,250 | $625 | $3,625 |
Source: Public Records
Map
Nearby Homes
- 4765 Conner Whitefield Rd
- 5720 Conner Whitefield Rd
- 000 Conner Whitefield Rd
- 75 Belton Rd
- 849 Belton Rd
- 176 Roy Crain Rd
- 000 Bluebird Hill Rd
- 622 Bluebird Hill Rd
- 2656 Curve Woodville Rd
- 273 N Main St
- 132 Skyline Dr
- 2143 Toulon Rd
- 1216 Cedar Grove Ext Rd
- 229 N Main St
- 2631 Highway 51 N
- 738 American Way
- 127 Jackson St
- 000 Monroe St
- 154 S Main St
- 114 S Jefferson St
- 30 Trader Ln
- 54 Trader Ln
- 4769 Conner Whitefield Rd
- 51 Trader Ln
- 4713 Conner Whitefield Rd
- 82 Trader Ln
- 53 Trader Ln
- 4783 Conner Whitefield Rd
- 0 Trader Ln
- 4795 Conner Whitefield Rd
- 4696 Conner Whitefield Rd
- 4714 Conner Whitefield Rd
- 4811 Conner Whitefield Rd
- 4760 Conner Whitefield Rd
- 4806 Conner Whitefield Rd
- 4848 Conner Whitefield Rd
- 2308 George Brown Rd
- 4874 Conner Whitefield Rd
- 4959 Conner Whitefield Rd
- 4443 Conner Whitefield Rd