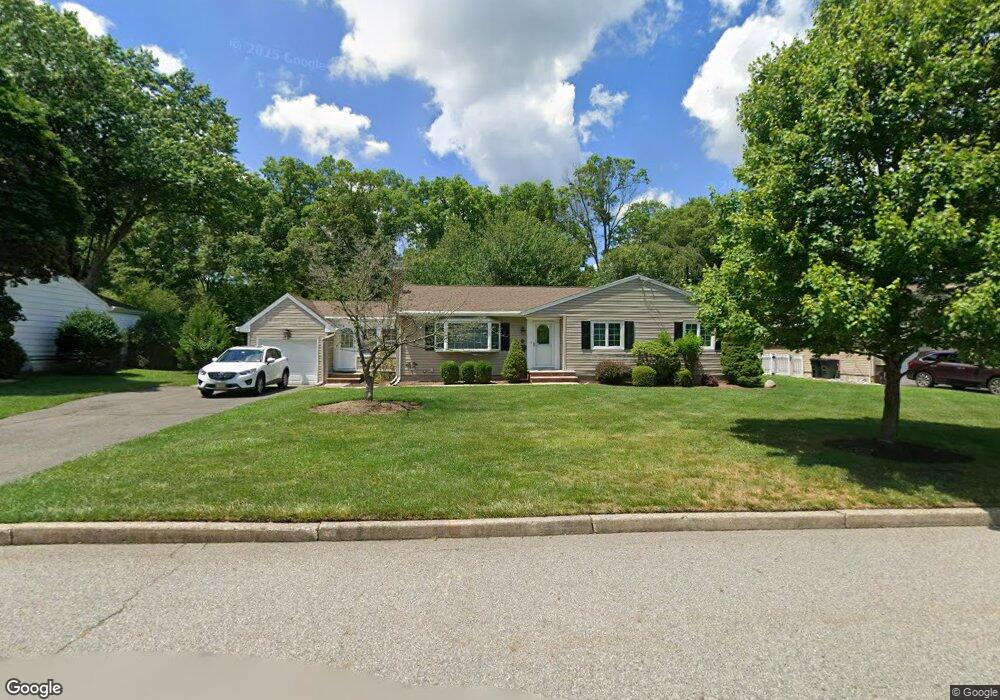
42 Tulip St Ramsey, NJ 07446
Estimated Value: $693,000 - $767,000
--
Bed
--
Bath
1,256
Sq Ft
$579/Sq Ft
Est. Value
About This Home
This home is located at 42 Tulip St, Ramsey, NJ 07446 and is currently estimated at $727,137, approximately $578 per square foot. 42 Tulip St is a home located in Bergen County with nearby schools including Ramsey High School, Young World Day School, and Guidepost Montessori at Mahwah.
Ownership History
Date
Name
Owned For
Owner Type
Purchase Details
Closed on
Aug 24, 2000
Sold by
Constantino Roxy John and Constantino Lisa M
Bought by
Betrus Luisa
Current Estimated Value
Purchase Details
Closed on
Apr 21, 1997
Sold by
Seel Maria T
Bought by
Costantino Roxy John and Costantino Lisa M
Home Financials for this Owner
Home Financials are based on the most recent Mortgage that was taken out on this home.
Original Mortgage
$180,000
Interest Rate
7.77%
Create a Home Valuation Report for This Property
The Home Valuation Report is an in-depth analysis detailing your home's value as well as a comparison with similar homes in the area
Home Values in the Area
Average Home Value in this Area
Purchase History
| Date | Buyer | Sale Price | Title Company |
|---|---|---|---|
| Betrus Luisa | $321,000 | -- | |
| Costantino Roxy John | $225,000 | -- |
Source: Public Records
Mortgage History
| Date | Status | Borrower | Loan Amount |
|---|---|---|---|
| Previous Owner | Costantino Roxy John | $180,000 |
Source: Public Records
Tax History Compared to Growth
Tax History
| Year | Tax Paid | Tax Assessment Tax Assessment Total Assessment is a certain percentage of the fair market value that is determined by local assessors to be the total taxable value of land and additions on the property. | Land | Improvement |
|---|---|---|---|---|
| 2025 | $12,631 | $634,700 | $402,800 | $231,900 |
| 2024 | $12,130 | $447,600 | $268,900 | $178,700 |
| 2023 | $11,625 | $443,200 | $268,900 | $174,300 |
| 2022 | $11,625 | $443,200 | $268,900 | $174,300 |
| 2021 | $10,471 | $443,200 | $268,900 | $174,300 |
| 2020 | $11,390 | $443,200 | $268,900 | $174,300 |
| 2019 | $10,894 | $443,200 | $268,900 | $174,300 |
| 2018 | $10,624 | $443,200 | $268,900 | $174,300 |
| 2017 | $10,424 | $443,200 | $268,900 | $174,300 |
| 2016 | $9,852 | $430,800 | $268,900 | $161,900 |
| 2015 | $9,740 | $360,600 | $250,200 | $110,400 |
| 2014 | $9,574 | $360,600 | $250,200 | $110,400 |
Source: Public Records
Map
Nearby Homes