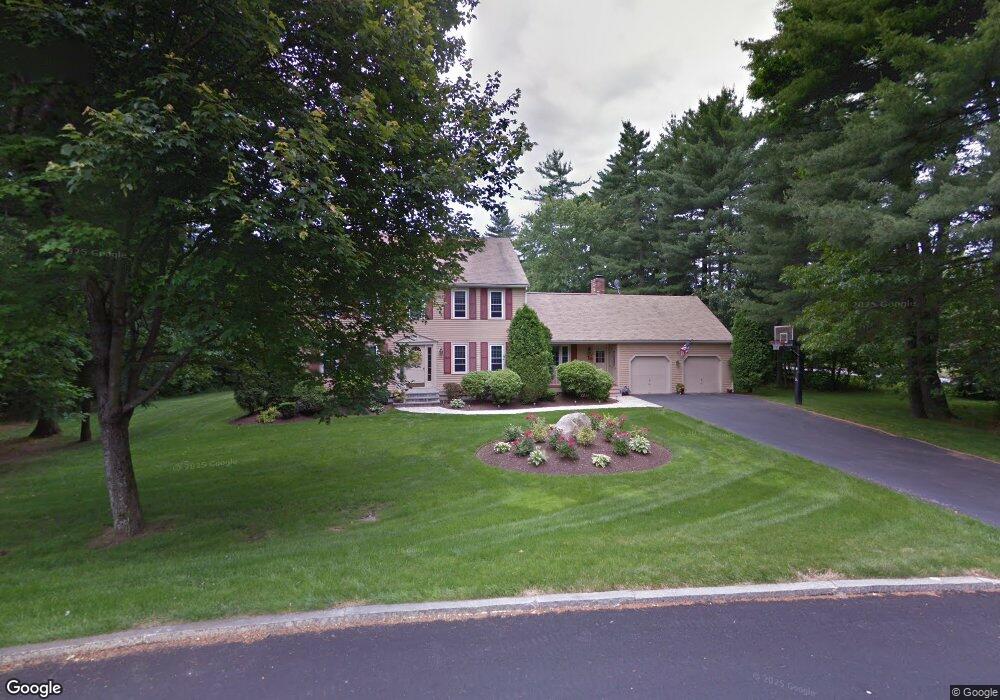
42 Tyler Ln Hanover, MA 02339
Estimated Value: $960,000 - $1,260,000
4
Beds
4
Baths
2,252
Sq Ft
$497/Sq Ft
Est. Value
About This Home
This home is located at 42 Tyler Ln, Hanover, MA 02339 and is currently estimated at $1,119,547, approximately $497 per square foot. 42 Tyler Ln is a home located in Plymouth County with nearby schools including Hanover High School, Calvary Chapel Academy, and Holy Family Elementary School.
Ownership History
Date
Name
Owned For
Owner Type
Purchase Details
Closed on
Apr 13, 2015
Sold by
Hult Joseph R and Hult Catherine A
Bought by
Hult T T and Hult H
Current Estimated Value
Purchase Details
Closed on
Aug 31, 1999
Sold by
Singh Pritam S and Singh Sudeep K
Bought by
Hult Joseph R and Hult Catherine A
Purchase Details
Closed on
Sep 28, 1989
Sold by
Continental Invest
Bought by
Singh Pritam S
Create a Home Valuation Report for This Property
The Home Valuation Report is an in-depth analysis detailing your home's value as well as a comparison with similar homes in the area
Home Values in the Area
Average Home Value in this Area
Purchase History
We collect this data history from publicly available records. To have your information removed, we recommend requesting removal directly through your county’s website.
| Date | Buyer | Sale Price | Title Company |
|---|---|---|---|
| Hult T T | -- | -- | |
| Hult T T | -- | -- | |
| Hult Joseph R | $355,000 | -- | |
| Hult Joseph R | $355,000 | -- | |
| Singh Pritam S | $267,500 | -- | |
| Singh Pritam S | $267,500 | -- |
Source: Public Records
Mortgage History
We collect this data history from publicly available records. To have your information removed, we recommend requesting removal directly through your county’s website.
| Date | Status | Borrower | Loan Amount |
|---|---|---|---|
| Previous Owner | Singh Pritam S | $200,000 | |
| Previous Owner | Singh Pritam S | $180,000 |
Source: Public Records
Tax History
| Year | Tax Paid | Tax Assessment Tax Assessment Total Assessment is a certain percentage of the fair market value that is determined by local assessors to be the total taxable value of land and additions on the property. | Land | Improvement |
|---|---|---|---|---|
| 2025 | $10,995 | $890,300 | $325,400 | $564,900 |
| 2024 | $10,724 | $835,200 | $325,400 | $509,800 |
| 2023 | $10,153 | $752,600 | $295,700 | $456,900 |
| 2022 | $9,708 | $636,600 | $246,400 | $390,200 |
| 2021 | $9,548 | $584,700 | $224,200 | $360,500 |
| 2020 | $8,745 | $568,700 | $224,200 | $344,500 |
| 2019 | $8,504 | $546,200 | $224,200 | $322,000 |
| 2018 | $8,291 | $514,100 | $224,200 | $289,900 |
| 2017 | $7,867 | $517,200 | $234,400 | $282,800 |
| 2016 | $8,253 | $489,500 | $213,100 | $276,400 |
| 2015 | $8,217 | $508,800 | $232,400 | $276,400 |
Source: Public Records
Map
Nearby Homes
- 283 Pond St
- 491 Webster St
- 29 Saw Mill Ln
- 107 Pond St
- 183 Whiting St
- 110 Country Rd
- 11 Boxberry Ln
- 196 Myrtle St
- 17 Sunnybank Ave
- 10 Sunnybank Ave
- 92-94 Stanton St
- 48 Bigelow Ave
- 224 Liberty St
- 471 Union St
- 173 Liberty St
- 19 Harvest Ln
- 107 E Water St
- 9 Juniper Cir
- 87 Leisurewoods Dr
- 214 Washington St Unit 28
Your Personal Tour Guide
Ask me questions while you tour the home.