
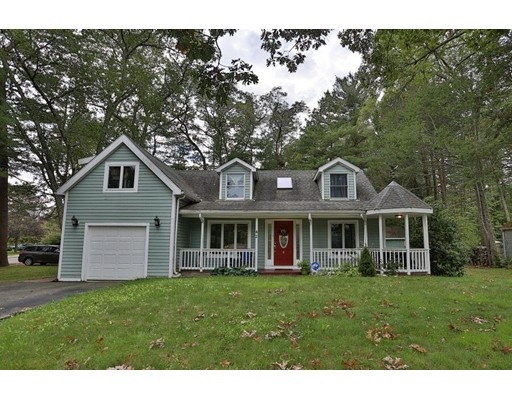
42 Walpole St Sharon, MA 02067
4
Beds
3
Baths
1,668
Sq Ft
10,454
Sq Ft Lot
About This Home
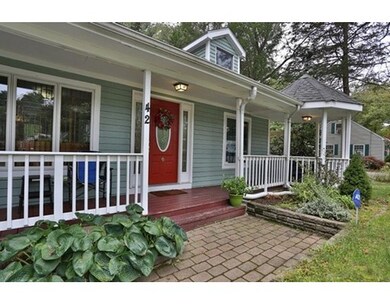
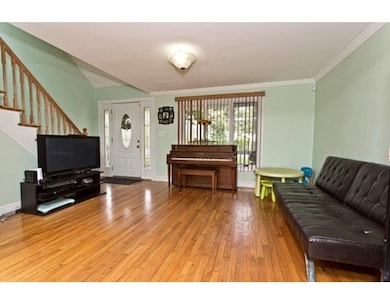
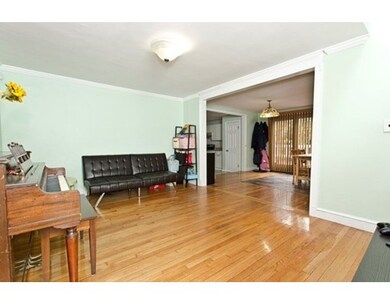
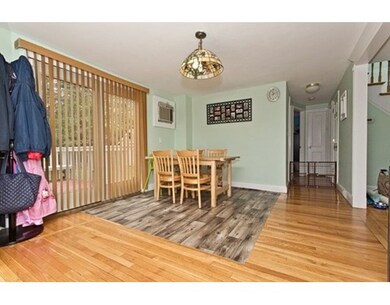
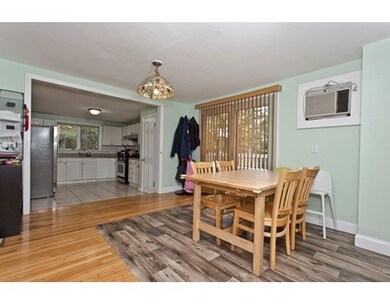
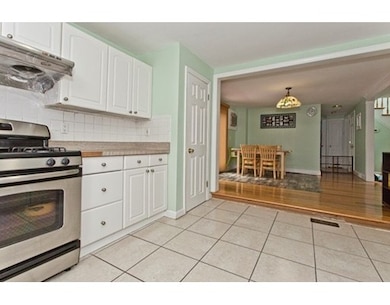
As of January 2018Charm and Character fills this beautiful cape. The moment you walk into the living room you will enjoy the bright and sunny floor plan and the gleaming hardwood floor. The living room opens up to the dining room that has a slider that leads to the deck and flat, level and private backyard which is ideal for entertaining. Other features include spacious 4 Bedrooms, 2.5 Baths, plenty of extra storage, a one car garage, updated bathrooms, central air, a full basement and a farmers porch that is ideal for moments of peace and tranquility. Located in the ideal neighborhood.CSA farm with organic vegetables and fruit nearby. Just a 10 minute walk to the Elementary School. Conveniently located to shopping and highway. Welcome home!!!
Home Details
Home Type
- Single Family
Est. Annual Taxes
- $9,607
Year Built
- 1948
Utilities
- Private Sewer
Ownership History
Date
Name
Owned For
Owner Type
Purchase Details
Listed on
Oct 17, 2017
Closed on
Jan 31, 2018
Sold by
Chen Qiong and Chen Meng E
Bought by
Khir Nadir
Seller's Agent
Angela Cui
Keller Williams Realty
Buyer's Agent
Mohamed Salhi
MS Golden Realty LLC
List Price
$449,900
Sold Price
$430,000
Premium/Discount to List
-$19,900
-4.42%
Total Days on Market
48
Current Estimated Value
Home Financials for this Owner
Home Financials are based on the most recent Mortgage that was taken out on this home.
Estimated Appreciation
$244,757
Avg. Annual Appreciation
6.06%
Original Mortgage
$270,000
Interest Rate
5.88%
Mortgage Type
New Conventional
Purchase Details
Closed on
Oct 30, 2017
Sold by
Chen Qiong and Chen Meng E
Bought by
Chen Qiong and Chen Meng E
Purchase Details
Listed on
Aug 6, 2012
Closed on
Oct 10, 2012
Sold by
Nelson Presly
Bought by
Chen Qiong and Chen Meng E
Seller's Agent
Margot Hampe
Selling Houses
Buyer's Agent
Ken Huang
Central Real Estate
List Price
$339,900
Sold Price
$325,000
Premium/Discount to List
-$14,900
-4.38%
Home Financials for this Owner
Home Financials are based on the most recent Mortgage that was taken out on this home.
Avg. Annual Appreciation
5.79%
Original Mortgage
$243,750
Interest Rate
3.59%
Mortgage Type
New Conventional
Purchase Details
Listed on
Dec 22, 2010
Closed on
Jan 20, 2012
Sold by
Polynice Remercile
Bought by
Nelson Presly
Seller's Agent
Margot Hampe
Selling Houses
Buyer's Agent
Margot Hampe
Selling Houses
List Price
$420,000
Sold Price
$280,000
Premium/Discount to List
-$140,000
-33.33%
Home Financials for this Owner
Home Financials are based on the most recent Mortgage that was taken out on this home.
Avg. Annual Appreciation
23.00%
Original Mortgage
$272,902
Interest Rate
3.98%
Mortgage Type
New Conventional
Purchase Details
Closed on
Jan 27, 2006
Sold by
Tobin Merry A and Acosta-Tobin Merry
Bought by
Polynice Remercile
Home Financials for this Owner
Home Financials are based on the most recent Mortgage that was taken out on this home.
Original Mortgage
$365,750
Interest Rate
6.34%
Mortgage Type
Purchase Money Mortgage
Purchase Details
Closed on
Sep 29, 2000
Sold by
Slaney Ruth
Bought by
Acosta-Tobin Merry and Tobin Paul
Home Financials for this Owner
Home Financials are based on the most recent Mortgage that was taken out on this home.
Original Mortgage
$145,350
Interest Rate
7.94%
Mortgage Type
Purchase Money Mortgage
Similar Home in Sharon, MA
Create a Home Valuation Report for This Property
The Home Valuation Report is an in-depth analysis detailing your home's value as well as a comparison with similar homes in the area
Home Values in the Area
Average Home Value in this Area
Purchase History
| Date | Type | Sale Price | Title Company |
|---|---|---|---|
| Not Resolvable | $430,000 | -- | |
| Quit Claim Deed | -- | -- | |
| Not Resolvable | $325,000 | -- | |
| Not Resolvable | $280,000 | -- | |
| Deed | $385,000 | -- | |
| Deed | $171,000 | -- |
Source: Public Records
Mortgage History
| Date | Status | Loan Amount | Loan Type |
|---|---|---|---|
| Open | $259,000 | Stand Alone Refi Refinance Of Original Loan | |
| Closed | $270,000 | New Conventional | |
| Previous Owner | $243,750 | New Conventional | |
| Previous Owner | $272,902 | New Conventional | |
| Previous Owner | $365,750 | Purchase Money Mortgage | |
| Previous Owner | $310,000 | No Value Available | |
| Previous Owner | $275,000 | No Value Available | |
| Previous Owner | $240,000 | No Value Available | |
| Previous Owner | $34,914 | No Value Available | |
| Previous Owner | $195,000 | No Value Available | |
| Previous Owner | $145,350 | Purchase Money Mortgage | |
| Previous Owner | $68,419 | No Value Available |
Source: Public Records
Property History
| Date | Event | Price | Change | Sq Ft Price |
|---|---|---|---|---|
| 01/31/2018 01/31/18 | Sold | $430,000 | -2.3% | $258 / Sq Ft |
| 12/04/2017 12/04/17 | Pending | -- | -- | -- |
| 11/15/2017 11/15/17 | Price Changed | $439,900 | -2.2% | $264 / Sq Ft |
| 10/17/2017 10/17/17 | For Sale | $449,900 | +38.4% | $270 / Sq Ft |
| 10/10/2012 10/10/12 | Sold | $325,000 | -4.4% | $195 / Sq Ft |
| 08/15/2012 08/15/12 | Pending | -- | -- | -- |
| 08/06/2012 08/06/12 | For Sale | $339,900 | +21.4% | $204 / Sq Ft |
| 01/20/2012 01/20/12 | Sold | $280,000 | -6.7% | $168 / Sq Ft |
| 01/06/2012 01/06/12 | Pending | -- | -- | -- |
| 11/05/2011 11/05/11 | Price Changed | $300,000 | -8.5% | $180 / Sq Ft |
| 08/05/2011 08/05/11 | Price Changed | $327,900 | 0.0% | $197 / Sq Ft |
| 07/14/2011 07/14/11 | Price Changed | $328,000 | -0.3% | $197 / Sq Ft |
| 07/13/2011 07/13/11 | Price Changed | $329,000 | +3.1% | $197 / Sq Ft |
| 07/06/2011 07/06/11 | Price Changed | $319,000 | -3.0% | $191 / Sq Ft |
| 06/25/2011 06/25/11 | Price Changed | $329,000 | -2.9% | $197 / Sq Ft |
| 06/18/2011 06/18/11 | Price Changed | $339,000 | -2.9% | $203 / Sq Ft |
| 06/06/2011 06/06/11 | Price Changed | $349,000 | -2.8% | $209 / Sq Ft |
| 05/28/2011 05/28/11 | Price Changed | $359,000 | -2.7% | $215 / Sq Ft |
| 05/24/2011 05/24/11 | Price Changed | $369,000 | -2.6% | $221 / Sq Ft |
| 04/20/2011 04/20/11 | Price Changed | $379,000 | +99900.0% | $227 / Sq Ft |
| 04/15/2011 04/15/11 | Price Changed | $379 | -99.9% | $0 / Sq Ft |
| 03/25/2011 03/25/11 | Price Changed | $384,000 | -1.3% | $230 / Sq Ft |
| 03/02/2011 03/02/11 | Price Changed | $389,000 | -2.5% | $233 / Sq Ft |
| 01/06/2011 01/06/11 | Price Changed | $399,000 | -5.0% | $239 / Sq Ft |
| 12/22/2010 12/22/10 | For Sale | $420,000 | -- | $252 / Sq Ft |
Source: MLS Property Information Network (MLS PIN)
Tax History Compared to Growth
Tax History
| Year | Tax Paid | Tax Assessment Tax Assessment Total Assessment is a certain percentage of the fair market value that is determined by local assessors to be the total taxable value of land and additions on the property. | Land | Improvement |
|---|---|---|---|---|
| 2025 | $9,607 | $549,600 | $351,200 | $198,400 |
| 2024 | $9,152 | $520,600 | $322,200 | $198,400 |
| 2023 | $8,959 | $481,900 | $301,100 | $180,800 |
| 2022 | $8,368 | $423,700 | $250,900 | $172,800 |
| 2021 | $8,170 | $399,900 | $236,700 | $163,200 |
| 2020 | $7,598 | $399,900 | $236,700 | $163,200 |
| 2019 | $7,234 | $372,700 | $209,500 | $163,200 |
| 2018 | $7,140 | $368,600 | $205,400 | $163,200 |
| 2017 | $6,967 | $355,100 | $191,900 | $163,200 |
| 2016 | $6,853 | $340,800 | $191,900 | $148,900 |
| 2015 | $6,441 | $317,300 | $176,100 | $141,200 |
| 2014 | $5,955 | $289,800 | $160,100 | $129,700 |
Source: Public Records
Agents Affiliated with this Home
-
Angela Cui
Seller's Agent in 2018
Angela Cui
Keller Williams Realty
(857) 498-7037
1 in this area
374 Total Sales
-
Mohamed Salhi
M
Buyer's Agent in 2018
Mohamed Salhi
MS Golden Realty LLC
(781) 498-7174
11 Total Sales
-
Margot Hampe
Seller's Agent in 2012
Margot Hampe
Selling Houses
(781) 956-9946
4 Total Sales
-
Ken Huang
Buyer's Agent in 2012
Ken Huang
Central Real Estate
(617) 828-1869
28 Total Sales
Map
Source: MLS Property Information Network (MLS PIN)
MLS Number: 72243690
APN: SHAR-000068-000030
Disclaimer: Certain information contained herein is derived from information provided by parties other than Homes.com. All information provided is deemed reliable, but is not guaranteed to be accurate and should be independently verified.
![]() The property listing data and information, or the Images, set forth herein were provided to MLS Property Information Network, Inc. from third party sources, including sellers, lessors and public records, and were compiled by MLS Property Information Network, Inc. The property listing data and information, and the Images, are for the personal, non-commercial use of consumers having a good faith interest in purchasing or leasing listed properties of the type displayed to them and may not be used for any purpose other than to identify prospective properties which such consumers may have a good faith interest in purchasing or leasing. MLS Property Information Network, Inc. and its subscribers disclaim any and all representations and warranties as to the accuracy of the property listing data and information, or as to the accuracy of any of the Images, set forth herein.
The property listing data and information, or the Images, set forth herein were provided to MLS Property Information Network, Inc. from third party sources, including sellers, lessors and public records, and were compiled by MLS Property Information Network, Inc. The property listing data and information, and the Images, are for the personal, non-commercial use of consumers having a good faith interest in purchasing or leasing listed properties of the type displayed to them and may not be used for any purpose other than to identify prospective properties which such consumers may have a good faith interest in purchasing or leasing. MLS Property Information Network, Inc. and its subscribers disclaim any and all representations and warranties as to the accuracy of the property listing data and information, or as to the accuracy of any of the Images, set forth herein.
Nearby Homes