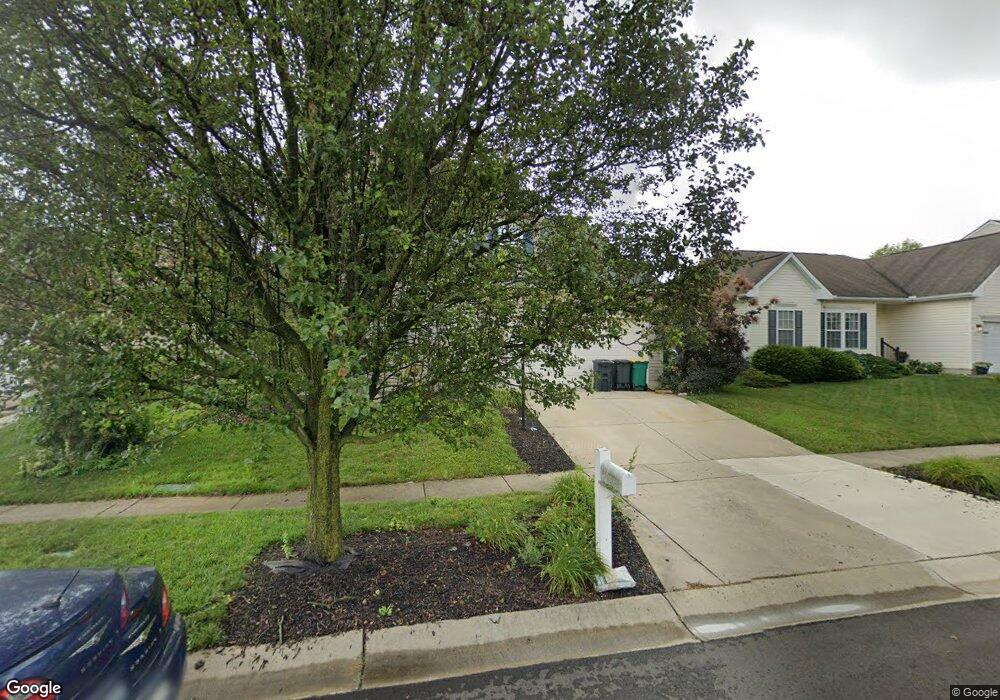
42 Wilbur Ln Springboro, OH 45066
Estimated Value: $388,761 - $415,000
4
Beds
2
Baths
2,287
Sq Ft
$176/Sq Ft
Est. Value
About This Home
This home is located at 42 Wilbur Ln, Springboro, OH 45066 and is currently estimated at $402,190, approximately $175 per square foot. 42 Wilbur Ln is a home located in Montgomery County with nearby schools including Clearcreek Elementary School, Springboro Intermediate School, and Springboro Junior High School.
Ownership History
Date
Name
Owned For
Owner Type
Purchase Details
Closed on
Feb 12, 2018
Sold by
Fornes Mark S and Estate Of Lawrence V Fornes
Bought by
Kelley Kelley S and Kelley Kelli L
Current Estimated Value
Home Financials for this Owner
Home Financials are based on the most recent Mortgage that was taken out on this home.
Original Mortgage
$53,600
Outstanding Balance
$45,032
Interest Rate
3.95%
Mortgage Type
New Conventional
Estimated Equity
$357,158
Purchase Details
Closed on
Oct 4, 2002
Sold by
Nvr Inc
Bought by
Kelley S Eric and Kelley Kelli L
Home Financials for this Owner
Home Financials are based on the most recent Mortgage that was taken out on this home.
Original Mortgage
$198,759
Interest Rate
6.1%
Mortgage Type
VA
Create a Home Valuation Report for This Property
The Home Valuation Report is an in-depth analysis detailing your home's value as well as a comparison with similar homes in the area
Purchase History
| Date | Buyer | Sale Price | Title Company |
|---|---|---|---|
| Kelley Kelley S | $67,000 | Fidelity Lawyers Title Agenc | |
| Kelley S Eric | $193,000 | -- |
Source: Public Records
Mortgage History
| Date | Status | Borrower | Loan Amount |
|---|---|---|---|
| Open | Kelley Kelley S | $53,600 | |
| Previous Owner | Kelley S Eric | $198,759 |
Source: Public Records
Tax History
| Year | Tax Paid | Tax Assessment Tax Assessment Total Assessment is a certain percentage of the fair market value that is determined by local assessors to be the total taxable value of land and additions on the property. | Land | Improvement |
|---|---|---|---|---|
| 2025 | $5,832 | $113,770 | $21,870 | $91,900 |
| 2024 | $5,908 | $113,770 | $21,870 | $91,900 |
| 2023 | $5,908 | $113,770 | $21,870 | $91,900 |
| 2022 | $4,537 | $80,120 | $15,400 | $64,720 |
| 2021 | $4,545 | $80,120 | $15,400 | $64,720 |
| 2020 | $4,708 | $80,120 | $15,400 | $64,720 |
| 2019 | $3,703 | $64,130 | $14,000 | $50,130 |
| 2018 | $3,713 | $64,130 | $14,000 | $50,130 |
| 2017 | $3,937 | $64,130 | $14,000 | $50,130 |
| 2016 | $3,849 | $60,800 | $14,000 | $46,800 |
| 2015 | $3,927 | $60,800 | $14,000 | $46,800 |
| 2014 | $3,927 | $60,800 | $14,000 | $46,800 |
| 2012 | -- | $64,080 | $14,000 | $50,080 |
Source: Public Records
Map
Nearby Homes
- 365 Crockett Dr
- 25 Blose Ct
- 33 Christman Dr
- 2002 Glen Valley Dr
- 2005 Glen Valley Dr Unit 210
- 2005 Glen Valley Dr
- 10084 Gully Pass Dr Unit 248
- 10084 Gully Pass Dr
- 195 Oasis Ct
- 10109 Gully Pass Dr Unit 250
- 10213 Gully Pass Dr Unit 251
- 10152 Gully Pass Dr
- 1701 Glade Valley Dr
- 250 Ballard Dr
- 1620 Glade Valley Dr
- 25 Glass Ct
- 92 Villa Pointe Dr Unit 92
- 80 Gregg Ct
- 1629 Glade Valley Dr Unit 88
- 160 Old Pond Rd
Your Personal Tour Guide
Ask me questions while you tour the home.