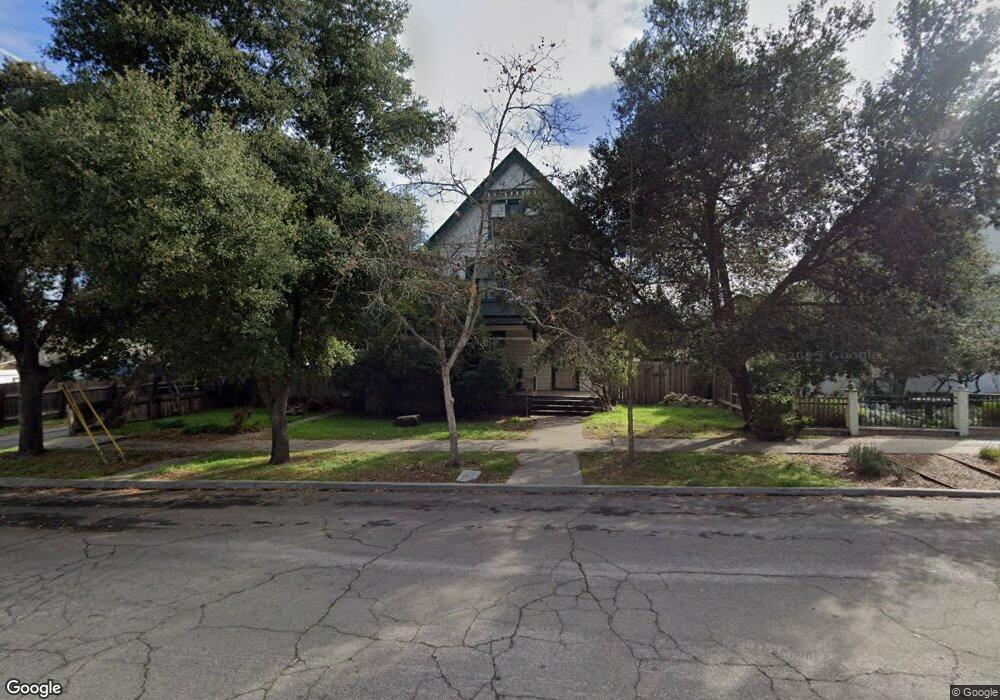
420 10th St Paso Robles, CA 93446
Estimated Value: $893,000 - $1,508,000
4
Beds
2
Baths
2,754
Sq Ft
$421/Sq Ft
Est. Value
About This Home
This home is located at 420 10th St, Paso Robles, CA 93446 and is currently estimated at $1,158,144, approximately $420 per square foot. 420 10th St is a home located in San Luis Obispo County with nearby schools including Glen Speck Elementary School, George H. Flamson Middle School, and Paso Robles High School.
Ownership History
Date
Name
Owned For
Owner Type
Purchase Details
Closed on
Oct 25, 1999
Sold by
Henderson Christine C
Bought by
Henderson Christine C and Henderson Alice E
Current Estimated Value
Purchase Details
Closed on
Mar 31, 1997
Sold by
Henderson Christine C and Henderson Alice E
Bought by
Henderson Christine C
Home Financials for this Owner
Home Financials are based on the most recent Mortgage that was taken out on this home.
Original Mortgage
$84,000
Interest Rate
8.08%
Mortgage Type
Purchase Money Mortgage
Purchase Details
Closed on
Mar 11, 1996
Sold by
Henderson Christine C and Henderson Alice Elodia
Bought by
Hende Rson Christine C and Henderson Alice E
Create a Home Valuation Report for This Property
The Home Valuation Report is an in-depth analysis detailing your home's value as well as a comparison with similar homes in the area
Home Values in the Area
Average Home Value in this Area
Purchase History
| Date | Buyer | Sale Price | Title Company |
|---|---|---|---|
| Henderson Christine C | -- | -- | |
| Henderson Christine C | -- | Chicago Title Co | |
| Henderson Christine C | -- | Chicago Title Co | |
| Hende Rson Christine C | -- | -- |
Source: Public Records
Mortgage History
| Date | Status | Borrower | Loan Amount |
|---|---|---|---|
| Closed | Henderson Christine C | $84,000 |
Source: Public Records
Tax History Compared to Growth
Tax History
| Year | Tax Paid | Tax Assessment Tax Assessment Total Assessment is a certain percentage of the fair market value that is determined by local assessors to be the total taxable value of land and additions on the property. | Land | Improvement |
|---|---|---|---|---|
| 2025 | $4,107 | $376,804 | $94,198 | $282,606 |
| 2024 | $4,040 | $369,416 | $92,351 | $277,065 |
| 2023 | $4,040 | $362,174 | $90,541 | $271,633 |
| 2022 | $3,980 | $355,073 | $88,766 | $266,307 |
| 2021 | $4,108 | $348,112 | $87,026 | $261,086 |
| 2020 | $3,859 | $344,543 | $86,134 | $258,409 |
| 2019 | $3,804 | $337,789 | $84,446 | $253,343 |
| 2018 | $3,752 | $331,167 | $82,791 | $248,376 |
| 2017 | $3,528 | $324,674 | $81,168 | $243,506 |
| 2016 | $3,459 | $318,309 | $79,577 | $238,732 |
| 2015 | $3,446 | $313,529 | $78,382 | $235,147 |
| 2014 | $3,327 | $307,388 | $76,847 | $230,541 |
Source: Public Records
Map
Nearby Homes