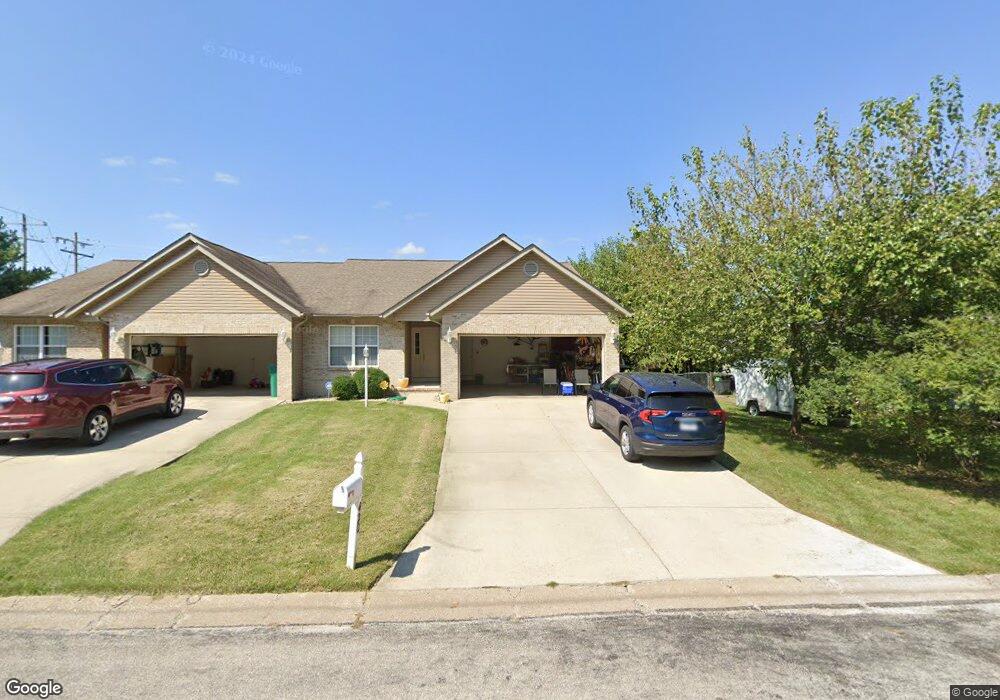
420 Aaron Dr Unit 13 Belleville, IL 62220
Estimated Value: $193,000 - $213,000
2
Beds
2
Baths
1,480
Sq Ft
$137/Sq Ft
Est. Value
About This Home
This home is located at 420 Aaron Dr Unit 13, Belleville, IL 62220 and is currently estimated at $202,310, approximately $136 per square foot. 420 Aaron Dr Unit 13 is a home located in St. Clair County with nearby schools including Roosevelt Elementary School, Central Jr High School, and Governor French Academy.
Ownership History
Date
Name
Owned For
Owner Type
Purchase Details
Closed on
Dec 2, 2013
Sold by
Secretary Of Housing & Urban Development
Bought by
Rakers David M and Rakers Leslie E
Current Estimated Value
Home Financials for this Owner
Home Financials are based on the most recent Mortgage that was taken out on this home.
Original Mortgage
$93,600
Outstanding Balance
$70,070
Interest Rate
4.25%
Mortgage Type
New Conventional
Estimated Equity
$132,240
Purchase Details
Closed on
Apr 3, 2012
Sold by
Becker Mark E
Bought by
The Secretary Of Housing & Urban Develop
Purchase Details
Closed on
Mar 31, 2006
Sold by
Ton Son
Bought by
Becker Mark A
Home Financials for this Owner
Home Financials are based on the most recent Mortgage that was taken out on this home.
Original Mortgage
$158,757
Interest Rate
6.38%
Mortgage Type
FHA
Create a Home Valuation Report for This Property
The Home Valuation Report is an in-depth analysis detailing your home's value as well as a comparison with similar homes in the area
Home Values in the Area
Average Home Value in this Area
Purchase History
| Date | Buyer | Sale Price | Title Company |
|---|---|---|---|
| Rakers David M | -- | Fatic | |
| The Secretary Of Housing & Urban Develop | -- | None Available | |
| Becker Mark A | $161,000 | Fatic |
Source: Public Records
Mortgage History
| Date | Status | Borrower | Loan Amount |
|---|---|---|---|
| Open | Rakers David M | $93,600 | |
| Previous Owner | Becker Mark A | $158,757 |
Source: Public Records
Tax History
| Year | Tax Paid | Tax Assessment Tax Assessment Total Assessment is a certain percentage of the fair market value that is determined by local assessors to be the total taxable value of land and additions on the property. | Land | Improvement |
|---|---|---|---|---|
| 2024 | $3,189 | $53,851 | $4,828 | $49,023 |
| 2023 | $2,976 | $48,735 | $4,761 | $43,974 |
| 2022 | $2,700 | $44,385 | $4,336 | $40,049 |
| 2021 | $2,631 | $42,563 | $4,158 | $38,405 |
| 2020 | $2,511 | $39,638 | $3,872 | $35,766 |
| 2019 | $2,578 | $41,473 | $4,228 | $37,245 |
| 2018 | $2,939 | $40,414 | $4,120 | $36,294 |
| 2017 | $2,876 | $39,338 | $4,010 | $35,328 |
| 2016 | $2,882 | $37,982 | $3,872 | $34,110 |
| 2014 | $2,668 | $39,627 | $8,054 | $31,573 |
| 2013 | $3,789 | $40,946 | $8,054 | $32,892 |
Source: Public Records
Map
Nearby Homes
- 130 Dianne Dr
- 49 Dianne Dr
- 1374 Rocky Creek Ct
- 245 Summers Trace
- 1366 Radden Ct
- 218 Winterberry Dr
- 516 Springwood Dr
- 2177 Southern Oak Cir
- 1412 4th Ave
- 1800 Roosevelt Ave
- 1210 3rd Ave
- 1801 Roosevelt Ave
- 807 Gass Ave
- 628 S 19th St
- 34 Lake Forest Dr
- 1316 Raab Ave
- 817 Union Ave
- 420 State St
- 719 Centreville Ave
- 419 S 8th St
- 424 Aaron Dr Unit 14
- 416 Aaron Dr
- 2321 Centreville Ave Unit 12
- 412 Aaron Dr
- 2317 Centreville Ave Unit 11
- 1920 Menard Dr
- 410 Aaron Dr
- 2313 Centreville Ave
- 2309 Centreville Ave Unit 9
- 1916 Menard Dr
- 404 Aaron Dr
- 2305 Centreville Ave Unit 8
- 2324 Centreville Ave
- 2301 Centreville Ave Unit 7
- 1923 Menard Dr
- 1912 Menard Dr
- 400 Aaron Dr
- 2221 Centreville Ave Unit 6
- 1913 Menard Dr
- 2217 Centreville Ave Unit 5
Your Personal Tour Guide
Ask me questions while you tour the home.