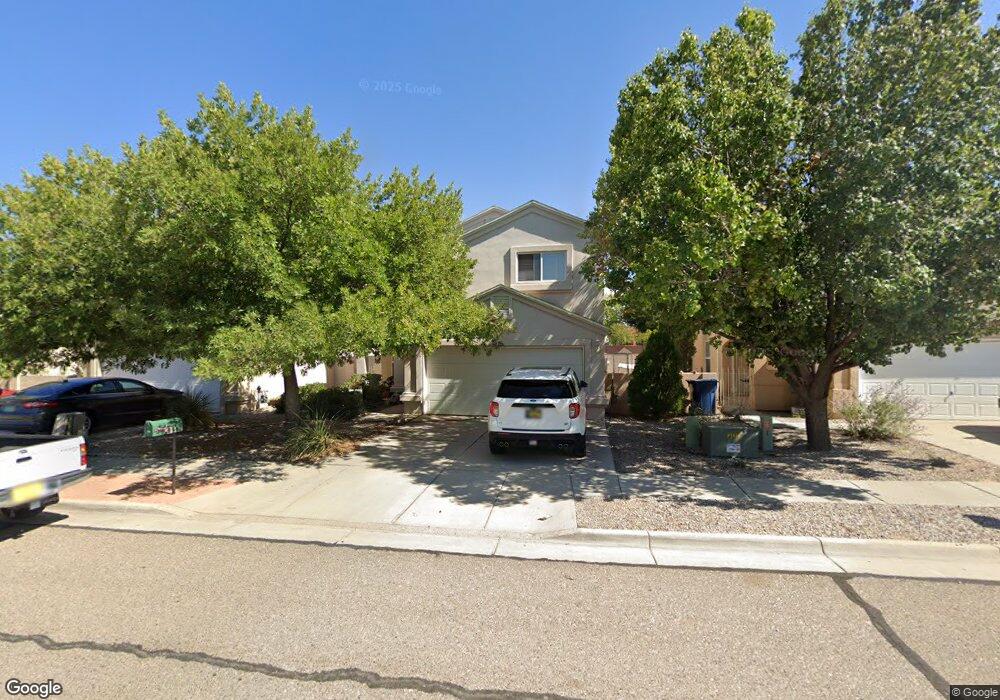
420 Angel Loop SW Unit 1 Los Lunas, NM 87031
Estimated Value: $243,000 - $300,000
3
Beds
3
Baths
1,590
Sq Ft
$173/Sq Ft
Est. Value
About This Home
This home is located at 420 Angel Loop SW Unit 1, Los Lunas, NM 87031 and is currently estimated at $274,899, approximately $172 per square foot. 420 Angel Loop SW Unit 1 is a home located in Valencia County with nearby schools including Katherine Gallegos Elementary School, Los Lunas Middle School, and Los Lunas High School.
Ownership History
Date
Name
Owned For
Owner Type
Purchase Details
Closed on
Jun 21, 2022
Sold by
Mccarty Hershell L and Mccarty Ethel L
Bought by
Mccarty Living Trust
Current Estimated Value
Purchase Details
Closed on
Feb 16, 2012
Sold by
Federal National Mortgage Association
Bought by
Mccarty Hershell and Mccarty Ethel L
Home Financials for this Owner
Home Financials are based on the most recent Mortgage that was taken out on this home.
Original Mortgage
$82,450
Interest Rate
3.95%
Mortgage Type
New Conventional
Purchase Details
Closed on
Jul 6, 2011
Sold by
Flagstar Bank Fsb
Bought by
Federal National Mortgage Association
Purchase Details
Closed on
Jan 10, 2007
Sold by
Debaca Diana Y
Bought by
Sepulveda Jose
Home Financials for this Owner
Home Financials are based on the most recent Mortgage that was taken out on this home.
Original Mortgage
$41,750
Interest Rate
5.83%
Mortgage Type
Stand Alone Second
Create a Home Valuation Report for This Property
The Home Valuation Report is an in-depth analysis detailing your home's value as well as a comparison with similar homes in the area
Home Values in the Area
Average Home Value in this Area
Purchase History
| Date | Buyer | Sale Price | Title Company |
|---|---|---|---|
| Mccarty Living Trust | -- | None Listed On Document | |
| Mccarty Hershell | $116,400 | Fidelity National Title Insu | |
| Federal National Mortgage Association | -- | -- | |
| Sepulveda Jose | -- | First American Title Insuran |
Source: Public Records
Mortgage History
| Date | Status | Borrower | Loan Amount |
|---|---|---|---|
| Previous Owner | Mccarty Hershell | $82,450 | |
| Previous Owner | Sepulveda Jose | $41,750 |
Source: Public Records
Tax History Compared to Growth
Tax History
| Year | Tax Paid | Tax Assessment Tax Assessment Total Assessment is a certain percentage of the fair market value that is determined by local assessors to be the total taxable value of land and additions on the property. | Land | Improvement |
|---|---|---|---|---|
| 2024 | $1,429 | $43,147 | $9,150 | $33,997 |
| 2023 | $1,378 | $41,890 | $8,943 | $32,947 |
| 2022 | $1,355 | $40,671 | $8,583 | $32,088 |
| 2021 | $1,347 | $40,052 | $8,840 | $31,212 |
| 2020 | $1,333 | $38,886 | $8,583 | $30,303 |
| 2019 | $1,301 | $37,754 | $8,583 | $29,171 |
| 2018 | $1,279 | $37,754 | $8,583 | $29,171 |
| 2017 | $1,233 | $36,980 | $8,583 | $28,397 |
| 2016 | $1,199 | $35,903 | $8,583 | $27,320 |
| 2015 | -- | $34,858 | $8,583 | $26,275 |
| 2013 | -- | $32,857 | $8,583 | $24,274 |
| 2011 | -- | $97,701 | $24,999 | $72,702 |
Source: Public Records
Map
Nearby Homes
- 1628 Drake Rd
- 0 Drake Rd
- 0 Main Grant
- 981 Canal Blvd SW
- 1107 Valley View Dr SW
- 1034 Wagon Trail St
- 1050 Wagon Trail St SW
- 00 New Mexico 6
- 823 Corral St SW
- 2258 Calle de Ortiz SW
- 1330 Crestview Dr SW
- 2260 Calle de Alifas SW
- 2260 Firewheel Ave SW
- 1864 Villa Contesa Loop NW
- 2512 Red Sky SW
- 1407 Valley View Dr SW
- 2601 Scarlet Sage Rd SW
- 960 Firewheel Loop SW
- 660 Primrose Ave SW
- 2248 Calle de Silverio
- 420 Angel Loop SW
- 430 Angel Loop SW
- 410 Angel Loop SW
- 440 Angel Loop SW
- 450 Angel Loop SW
- 431 Angel Loop SW
- 421 Angel Loop SW
- 411 Angel Loop SW
- 460 Angel Loop SW
- 441 Angel Loop SW
- 401 Angel Loop SW
- 451 Angel Loop SW
- 470 Angel Loop SW
- 539 Long Bow Loop SW
- 541 Long Bow Loop SW
- 461 Angel Loop SW
- 571 Angel Loop SW
- 561 Angel Loop SW
- 581 Angel Loop SW
- 541 Angel Loop SW