
420 Baker St West Roxbury, MA 02132
West Roxbury Neighborhood
3
Beds
2
Baths
1,250
Sq Ft
3,920
Sq Ft Lot
About This Home
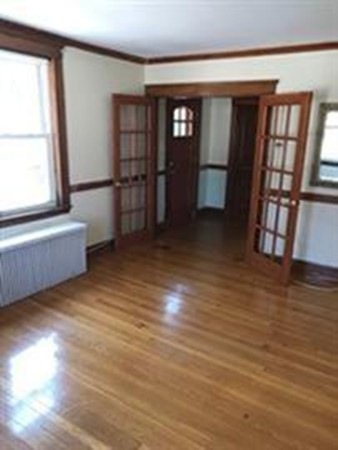
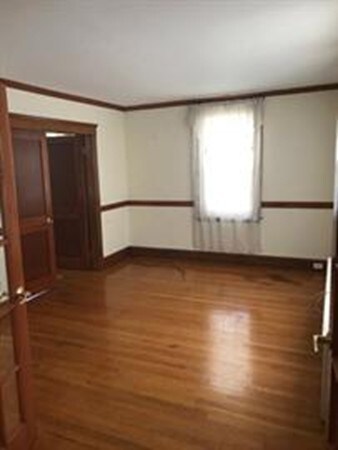
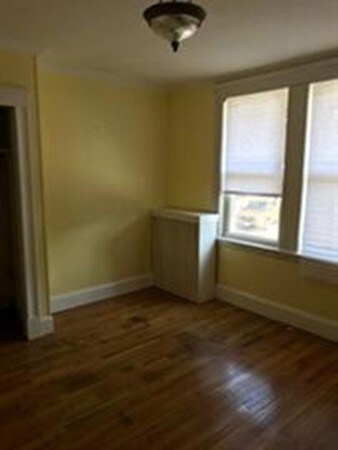
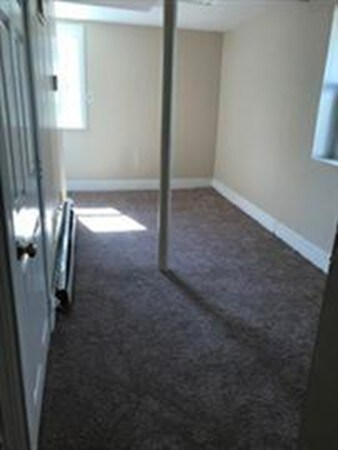
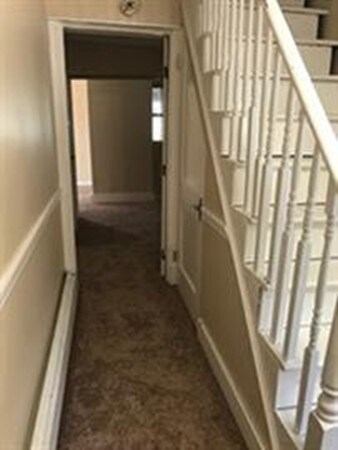
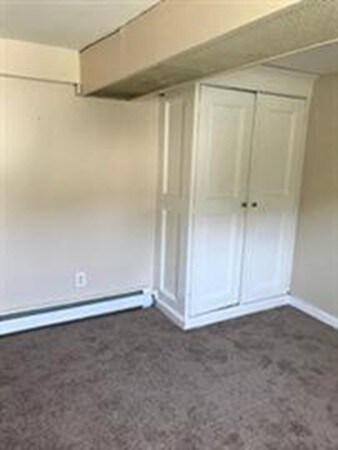
As of March 2020Come take a look at this fantastic opportunity to own this beautiful house in West Roxbury near the Newton line, close to public transportation, shopping, restaurants & parks. This cozy 3 beds in which 2 of the bedroom are located in the main living space and the 3rd bedroom is located in the basement with an area for a play room and a full bathroom. This house is on three T-stops-that cover all of metro Boston, short walk to commuter rail. As well as a short walk to center of West Roxbury, with all of it's shopping. Short walk to athletic track at Catholic Memorial. Short drive to area hospitals, Faulkner, Beth Israel, Mass General. House to be SOLD AS IS.... 24 hour notification needed to view the property.
Home Details
Home Type
- Single Family
Est. Annual Taxes
- $6,958
Year Built
- Built in 1937
Parking
- 2 Car Garage
Kitchen
- Range
- Microwave
- Dishwasher
- Disposal
Flooring
- Wood
- Tile
Utilities
- Window Unit Cooling System
- Hot Water Baseboard Heater
- Heating System Uses Gas
- Natural Gas Water Heater
Additional Features
- Deck
- Property is zoned RES1
Listing and Financial Details
- Assessor Parcel Number W:20 P:09086 S:000
Ownership History
Date
Name
Owned For
Owner Type
Purchase Details
Listed on
Jan 15, 2020
Closed on
Mar 4, 2020
Sold by
Acquah Gary
Bought by
Shimko Eitan and Shimko Amanda
Seller's Agent
Delince Louis
Redfin Corp.
Buyer's Agent
Anne Mahon
Leading Edge Real Estate
List Price
$525,000
Sold Price
$506,500
Premium/Discount to List
-$18,500
-3.52%
Current Estimated Value
Home Financials for this Owner
Home Financials are based on the most recent Mortgage that was taken out on this home.
Estimated Appreciation
$204,401
Avg. Annual Appreciation
6.64%
Original Mortgage
$405,200
Outstanding Balance
$363,324
Interest Rate
3.6%
Mortgage Type
New Conventional
Estimated Equity
$348,205
Purchase Details
Listed on
Jun 24, 2019
Closed on
Aug 15, 2019
Sold by
Weeks Maureen
Bought by
Acquah Gary
Seller's Agent
George Sariego
Boston One Realty Group Inc
Buyer's Agent
George Sariego
Boston One Realty Group Inc
List Price
$459,999
Sold Price
$410,000
Premium/Discount to List
-$49,999
-10.87%
Home Financials for this Owner
Home Financials are based on the most recent Mortgage that was taken out on this home.
Avg. Annual Appreciation
47.91%
Original Mortgage
$389,500
Interest Rate
3.7%
Mortgage Type
New Conventional
Purchase Details
Closed on
Feb 6, 2007
Sold by
Mcgoldrick Brian and Mcgoldrick Jennifer
Bought by
Weeks Maureen
Home Financials for this Owner
Home Financials are based on the most recent Mortgage that was taken out on this home.
Original Mortgage
$284,000
Interest Rate
6.16%
Mortgage Type
Purchase Money Mortgage
Purchase Details
Closed on
Sep 30, 2003
Sold by
Noonan Patrick
Bought by
Odonnell Jennifer and Mcgoldrick Brian
Home Financials for this Owner
Home Financials are based on the most recent Mortgage that was taken out on this home.
Original Mortgage
$282,000
Interest Rate
6.29%
Mortgage Type
Purchase Money Mortgage
Purchase Details
Closed on
Mar 26, 1997
Sold by
Vanschelt Robert A
Bought by
Noonan Patrick F
Similar Homes in West Roxbury, MA
Create a Home Valuation Report for This Property
The Home Valuation Report is an in-depth analysis detailing your home's value as well as a comparison with similar homes in the area
Home Values in the Area
Average Home Value in this Area
Purchase History
| Date | Type | Sale Price | Title Company |
|---|---|---|---|
| Not Resolvable | $506,500 | None Available | |
| Not Resolvable | $410,000 | -- | |
| Deed | $355,000 | -- | |
| Deed | $352,500 | -- | |
| Deed | $122,000 | -- |
Source: Public Records
Mortgage History
| Date | Status | Loan Amount | Loan Type |
|---|---|---|---|
| Open | $405,200 | New Conventional | |
| Previous Owner | $389,500 | New Conventional | |
| Previous Owner | $241,000 | Stand Alone Refi Refinance Of Original Loan | |
| Previous Owner | $284,000 | Purchase Money Mortgage | |
| Previous Owner | $71,000 | No Value Available | |
| Previous Owner | $282,000 | Purchase Money Mortgage | |
| Previous Owner | $50,000 | No Value Available | |
| Previous Owner | $108,000 | No Value Available |
Source: Public Records
Property History
| Date | Event | Price | Change | Sq Ft Price |
|---|---|---|---|---|
| 03/06/2020 03/06/20 | Sold | $506,500 | +1.3% | $318 / Sq Ft |
| 02/04/2020 02/04/20 | Pending | -- | -- | -- |
| 01/31/2020 01/31/20 | Price Changed | $500,000 | -4.8% | $314 / Sq Ft |
| 01/15/2020 01/15/20 | For Sale | $525,000 | +28.0% | $330 / Sq Ft |
| 08/21/2019 08/21/19 | Sold | $410,000 | -8.9% | $328 / Sq Ft |
| 07/19/2019 07/19/19 | Pending | -- | -- | -- |
| 07/14/2019 07/14/19 | Price Changed | $449,999 | -2.2% | $360 / Sq Ft |
| 06/24/2019 06/24/19 | For Sale | $459,999 | 0.0% | $368 / Sq Ft |
| 11/29/2018 11/29/18 | Rented | $2,600 | 0.0% | -- |
| 11/27/2018 11/27/18 | Under Contract | -- | -- | -- |
| 10/23/2018 10/23/18 | For Rent | $2,600 | 0.0% | -- |
| 11/30/2017 11/30/17 | Rented | $2,600 | 0.0% | -- |
| 11/28/2017 11/28/17 | Under Contract | -- | -- | -- |
| 11/22/2017 11/22/17 | For Rent | $2,600 | 0.0% | -- |
| 11/10/2017 11/10/17 | Under Contract | -- | -- | -- |
| 10/31/2017 10/31/17 | For Rent | $2,600 | +8.3% | -- |
| 09/15/2017 09/15/17 | Rented | $2,400 | 0.0% | -- |
| 09/13/2017 09/13/17 | Under Contract | -- | -- | -- |
| 09/10/2017 09/10/17 | Price Changed | $2,400 | -4.0% | $2 / Sq Ft |
| 08/02/2017 08/02/17 | For Rent | $2,500 | -- | -- |
Source: MLS Property Information Network (MLS PIN)
Tax History Compared to Growth
Tax History
| Year | Tax Paid | Tax Assessment Tax Assessment Total Assessment is a certain percentage of the fair market value that is determined by local assessors to be the total taxable value of land and additions on the property. | Land | Improvement |
|---|---|---|---|---|
| 2025 | $6,958 | $600,900 | $162,700 | $438,200 |
| 2024 | $6,571 | $602,800 | $170,900 | $431,900 |
| 2023 | $6,167 | $574,200 | $162,800 | $411,400 |
| 2022 | $5,679 | $522,000 | $148,000 | $374,000 |
| 2021 | $4,828 | $452,500 | $145,100 | $307,400 |
| 2020 | $4,087 | $387,000 | $131,800 | $255,200 |
| 2019 | $3,884 | $368,500 | $110,600 | $257,900 |
| 2018 | $3,577 | $341,300 | $110,600 | $230,700 |
| 2017 | $3,541 | $334,400 | $110,600 | $223,800 |
| 2016 | $3,572 | $324,700 | $110,600 | $214,100 |
| 2015 | $3,476 | $287,000 | $131,100 | $155,900 |
| 2014 | $3,407 | $270,800 | $131,100 | $139,700 |
Source: Public Records
Agents Affiliated with this Home
-
Seller's Agent in 2020
Delince Louis
Redfin Corp.
(617) 501-0881
-
Anne Mahon
Buyer's Agent in 2020
Anne Mahon
Leading Edge Real Estate
(617) 990-7660
174 Total Sales
-
George Sariego
Seller's Agent in 2019
George Sariego
Boston One Realty Group Inc
(617) 704-0921
21 Total Sales
-
Humberto Ortega
H
Seller Co-Listing Agent in 2019
Humberto Ortega
Boston One Realty Group Inc
6 Total Sales
Map
Source: MLS Property Information Network (MLS PIN)
MLS Number: 72524171
APN: WROX-000000-000020-009086
Disclaimer: Certain information contained herein is derived from information provided by parties other than Homes.com. All information provided is deemed reliable, but is not guaranteed to be accurate and should be independently verified.
![]() The property listing data and information, or the Images, set forth herein were provided to MLS Property Information Network, Inc. from third party sources, including sellers, lessors and public records, and were compiled by MLS Property Information Network, Inc. The property listing data and information, and the Images, are for the personal, non-commercial use of consumers having a good faith interest in purchasing or leasing listed properties of the type displayed to them and may not be used for any purpose other than to identify prospective properties which such consumers may have a good faith interest in purchasing or leasing. MLS Property Information Network, Inc. and its subscribers disclaim any and all representations and warranties as to the accuracy of the property listing data and information, or as to the accuracy of any of the Images, set forth herein.
The property listing data and information, or the Images, set forth herein were provided to MLS Property Information Network, Inc. from third party sources, including sellers, lessors and public records, and were compiled by MLS Property Information Network, Inc. The property listing data and information, and the Images, are for the personal, non-commercial use of consumers having a good faith interest in purchasing or leasing listed properties of the type displayed to them and may not be used for any purpose other than to identify prospective properties which such consumers may have a good faith interest in purchasing or leasing. MLS Property Information Network, Inc. and its subscribers disclaim any and all representations and warranties as to the accuracy of the property listing data and information, or as to the accuracy of any of the Images, set forth herein.
Nearby Homes
- 990 Vfw Pkwy Unit 302
- 1100 Vfw Pkwy Unit 202
- 293 Temple St Unit 101
- 23 Baker Place
- 349 Baker St
- 349 Baker St Unit A
- 184 Perham St
- 57 Glenham St
- 1216 Vfw Pkwy Unit 47
- 1214 Vfw Pkwy Unit 37
- 89 Dent St
- 583 Baker St Unit 583
- 633 Lagrange St
- 188 Gardner St Unit 188
- 67 Gardner St
- 24 Ivory St
- 58 Gardner St
- 20 Tarleton Rd
- 487 Lagrange St
- 80 Mount Vernon St