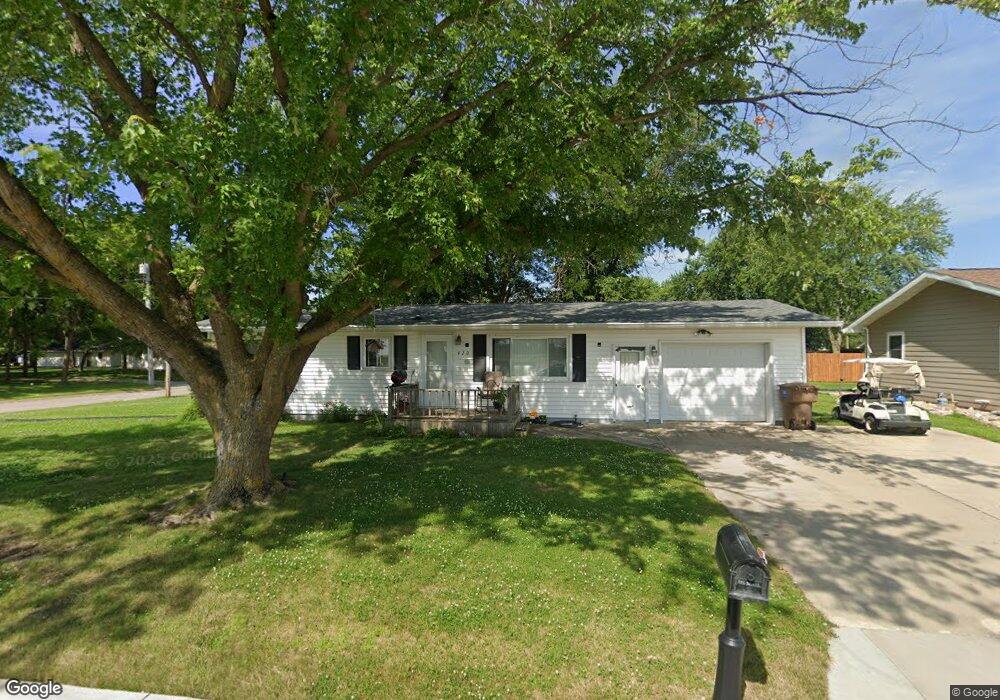
420 Brower St Rockwell City, IA 50579
Estimated Value: $93,898 - $120,000
2
Beds
1
Bath
960
Sq Ft
$113/Sq Ft
Est. Value
About This Home
This home is located at 420 Brower St, Rockwell City, IA 50579 and is currently estimated at $108,225, approximately $112 per square foot. 420 Brower St is a home located in Calhoun County with nearby schools including South Central Calhoun Elementary School, South Central Calhoun High School, and South Central Calhoun Middle School.
Ownership History
Date
Name
Owned For
Owner Type
Purchase Details
Closed on
Aug 27, 2021
Sold by
Anderson Janet K
Bought by
Schultz Brenda L and Anderson Melissa K
Current Estimated Value
Purchase Details
Closed on
Nov 1, 2011
Sold by
Hiler Thomas G and Hiler Sarah
Bought by
Anderson Janet Kay
Home Financials for this Owner
Home Financials are based on the most recent Mortgage that was taken out on this home.
Original Mortgage
$41,600
Interest Rate
4.12%
Mortgage Type
Future Advance Clause Open End Mortgage
Purchase Details
Closed on
Nov 7, 2007
Sold by
Hiller Darlene and Darlene Hiller K
Bought by
Hiler Thomas G
Home Financials for this Owner
Home Financials are based on the most recent Mortgage that was taken out on this home.
Original Mortgage
$28,729
Interest Rate
6.44%
Mortgage Type
Purchase Money Mortgage
Create a Home Valuation Report for This Property
The Home Valuation Report is an in-depth analysis detailing your home's value as well as a comparison with similar homes in the area
Home Values in the Area
Average Home Value in this Area
Purchase History
| Date | Buyer | Sale Price | Title Company |
|---|---|---|---|
| Schultz Brenda L | -- | None Listed On Document | |
| Anderson Michael J | -- | None Listed On Document | |
| Anderson Janet Kay | $52,000 | None Available | |
| Hiler Thomas G | $35,000 | -- |
Source: Public Records
Mortgage History
| Date | Status | Borrower | Loan Amount |
|---|---|---|---|
| Previous Owner | Anderson Janet Kay | $41,600 | |
| Previous Owner | Hiler Thomas G | $28,729 |
Source: Public Records
Tax History Compared to Growth
Tax History
| Year | Tax Paid | Tax Assessment Tax Assessment Total Assessment is a certain percentage of the fair market value that is determined by local assessors to be the total taxable value of land and additions on the property. | Land | Improvement |
|---|---|---|---|---|
| 2024 | $706 | $66,140 | $9,880 | $56,260 |
| 2023 | $1,160 | $66,140 | $9,880 | $56,260 |
| 2022 | $1,100 | $60,260 | $8,240 | $52,020 |
| 2021 | $1,062 | $60,260 | $8,240 | $52,020 |
| 2020 | $1,120 | $60,300 | $8,240 | $52,060 |
| 2019 | $974 | $52,610 | $8,240 | $44,370 |
| 2018 | $996 | $52,610 | $8,240 | $44,370 |
| 2017 | $996 | $52,610 | $8,240 | $44,370 |
| 2016 | $996 | $54,270 | $0 | $0 |
| 2015 | $996 | $55,480 | $0 | $0 |
| 2014 | $924 | $55,480 | $0 | $0 |
Source: Public Records
Map
Nearby Homes