Estimated Value: $92,000 - $130,000
3
Beds
1
Bath
1,159
Sq Ft
$95/Sq Ft
Est. Value
About This Home
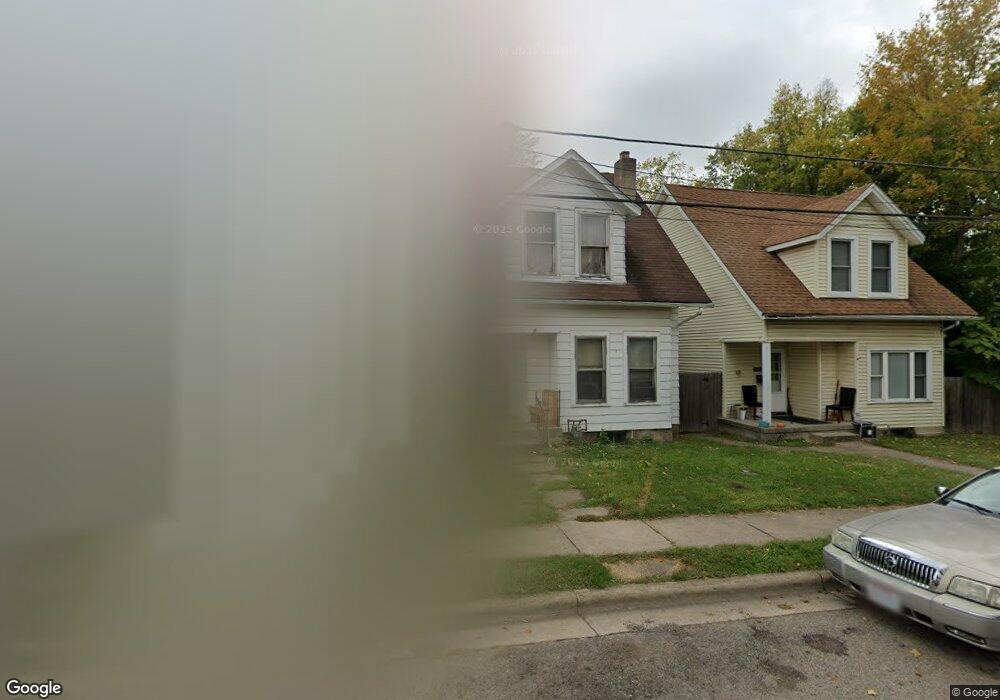
This home is located at 420 Chestnut St, Xenia, OH 45385 and is currently estimated at $110,025, approximately $94 per square foot. 420 Chestnut St is a home located in Greene County with nearby schools including Xenia High School, Summit Academy Community School for Alternative Learners - Xenia, and Legacy Christian Academy.
Ownership History
Date
Name
Owned For
Owner Type
Purchase Details
Closed on
Apr 23, 2015
Sold by
Banion Douglas G O and Banion Douglas O
Bought by
O Banion Properties Llc
Current Estimated Value
Purchase Details
Closed on
Nov 15, 2000
Sold by
Honeycutt Robert W and Honeycutt David L
Bought by
Obanion Douglas G and Obanion Jill K
Home Financials for this Owner
Home Financials are based on the most recent Mortgage that was taken out on this home.
Original Mortgage
$37,800
Interest Rate
7.87%
Create a Home Valuation Report for This Property
The Home Valuation Report is an in-depth analysis detailing your home's value as well as a comparison with similar homes in the area
Home Values in the Area
Average Home Value in this Area
Purchase History
| Date | Buyer | Sale Price | Title Company |
|---|---|---|---|
| O Banion Properties Llc | -- | Attorney | |
| Obanion Douglas G | $42,000 | -- |
Source: Public Records
Mortgage History
| Date | Status | Borrower | Loan Amount |
|---|---|---|---|
| Closed | Obanion Douglas G | $37,800 |
Source: Public Records
Tax History
| Year | Tax Paid | Tax Assessment Tax Assessment Total Assessment is a certain percentage of the fair market value that is determined by local assessors to be the total taxable value of land and additions on the property. | Land | Improvement |
|---|---|---|---|---|
| 2025 | $985 | $22,630 | $3,230 | $19,400 |
| 2024 | $985 | $22,630 | $3,230 | $19,400 |
| 2023 | $968 | $22,630 | $3,230 | $19,400 |
| 2022 | $862 | $17,180 | $2,580 | $14,600 |
| 2021 | $873 | $17,180 | $2,580 | $14,600 |
| 2020 | $837 | $17,180 | $2,580 | $14,600 |
| 2019 | $838 | $16,200 | $2,390 | $13,810 |
| 2018 | $842 | $16,200 | $2,390 | $13,810 |
| 2017 | $802 | $16,200 | $2,390 | $13,810 |
| 2016 | $802 | $15,150 | $2,390 | $12,760 |
| 2015 | $804 | $15,150 | $2,390 | $12,760 |
| 2014 | $770 | $15,150 | $2,390 | $12,760 |
Source: Public Records
Map
Nearby Homes
Your Personal Tour Guide
Ask me questions while you tour the home.