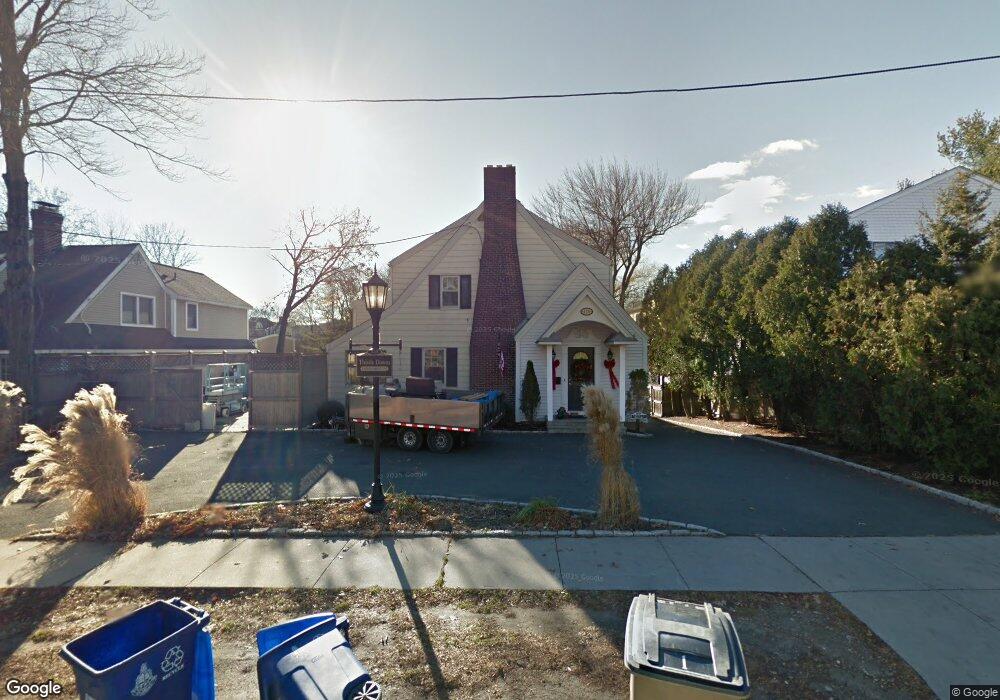
420 Courtland Ave Unit 2 Stamford, CT 06906
Glenbrook NeighborhoodEstimated Value: $425,000 - $474,000
2
Beds
2
Baths
1,345
Sq Ft
$330/Sq Ft
Est. Value
About This Home
This home is located at 420 Courtland Ave Unit 2, Stamford, CT 06906 and is currently estimated at $443,780, approximately $329 per square foot. 420 Courtland Ave Unit 2 is a home located in Fairfield County with nearby schools including Julia A. Stark Elementary School, Dolan School, and Stamford High School.
Ownership History
Date
Name
Owned For
Owner Type
Purchase Details
Closed on
Jan 30, 2007
Sold by
Mclellan Clare D
Bought by
Canzuneri Anthony
Current Estimated Value
Home Financials for this Owner
Home Financials are based on the most recent Mortgage that was taken out on this home.
Original Mortgage
$315,000
Interest Rate
6.15%
Purchase Details
Closed on
Nov 21, 2003
Sold by
Maubert Jean-Noel
Bought by
Mclellan Clare D
Home Financials for this Owner
Home Financials are based on the most recent Mortgage that was taken out on this home.
Original Mortgage
$234,000
Interest Rate
4.5%
Purchase Details
Closed on
Jun 19, 2002
Sold by
Conklin Lori A and Conklin Michael
Bought by
Maubert Jean-Noel
Purchase Details
Closed on
Apr 14, 1987
Sold by
Robotti William D
Bought by
Conklin Michael
Create a Home Valuation Report for This Property
The Home Valuation Report is an in-depth analysis detailing your home's value as well as a comparison with similar homes in the area
Home Values in the Area
Average Home Value in this Area
Purchase History
| Date | Buyer | Sale Price | Title Company |
|---|---|---|---|
| Canzuneri Anthony | $350,000 | -- | |
| Mclellan Clare D | $292,500 | -- | |
| Maubert Jean-Noel | $242,500 | -- | |
| Conklin Michael | $163,000 | -- |
Source: Public Records
Mortgage History
| Date | Status | Borrower | Loan Amount |
|---|---|---|---|
| Open | Conklin Michael | $300,230 | |
| Closed | Conklin Michael | $315,000 | |
| Previous Owner | Conklin Michael | $234,000 |
Source: Public Records
Tax History Compared to Growth
Tax History
| Year | Tax Paid | Tax Assessment Tax Assessment Total Assessment is a certain percentage of the fair market value that is determined by local assessors to be the total taxable value of land and additions on the property. | Land | Improvement |
|---|---|---|---|---|
| 2025 | $5,538 | $234,070 | $0 | $234,070 |
| 2024 | $5,416 | $234,070 | $0 | $234,070 |
| 2023 | $5,819 | $234,070 | $0 | $234,070 |
| 2022 | $5,576 | $208,530 | $0 | $208,530 |
| 2021 | $5,516 | $208,530 | $0 | $208,530 |
| 2020 | $5,374 | $208,530 | $0 | $208,530 |
| 2019 | $5,374 | $208,530 | $0 | $208,530 |
| 2018 | $5,176 | $208,530 | $0 | $208,530 |
| 2017 | $4,757 | $182,980 | $0 | $182,980 |
| 2016 | $4,624 | $182,980 | $0 | $182,980 |
| 2015 | $4,503 | $182,980 | $0 | $182,980 |
| 2014 | $4,353 | $182,980 | $0 | $182,980 |
Source: Public Records
Map
Nearby Homes
- 406 Courtland Ave Unit D
- 34 Crescent St Unit 2D
- 596 Glenbrook Rd Unit 36
- 43 Crescent St Unit 11
- 30 Maple Tree Ave Unit D
- 35 Maple Tree Ave Unit 6
- 62 Maple Tree Ave Unit 62
- 69 Maple Tree Ave Unit 4
- 30 Lenox Ave
- 88 Maple Tree Ave Unit G
- 415 West Ave
- 8 Windell Place
- 98 Holmes Ave
- 51 Glendale Rd
- 90 Courtland Hill St
- 88 Pine Hill Ave
- 151 Courtland Ave Unit 4
- 30 Lake Dr
- 31 Bellmere Ave
- 100 Hope St Unit 10
- 420 Courtland Ave Unit 5
- 420 Courtland Ave Unit 3
- 420 Courtland Ave Unit 1
- 422 Courtland Ave Unit 5
- 422 Courtland Ave Unit 4
- 422 Courtland Ave Unit 3
- 422 Courtland Ave Unit 2
- 422 Courtland Ave Unit 1
- 410 Courtland Ave
- 426 Courtland Ave Unit 4
- 426 Courtland Ave Unit 3
- 426 Courtland Ave Unit 2
- 406 Courtland Ave Unit E
- 406 Courtland Ave Unit D
- 406 Courtland Ave Unit C
- 406 Courtland Ave Unit B
- 406 Courtland Ave Unit A
- 35 Arthur Place
- 432 Courtland Ave
- 432 Courtland Ave Unit 432