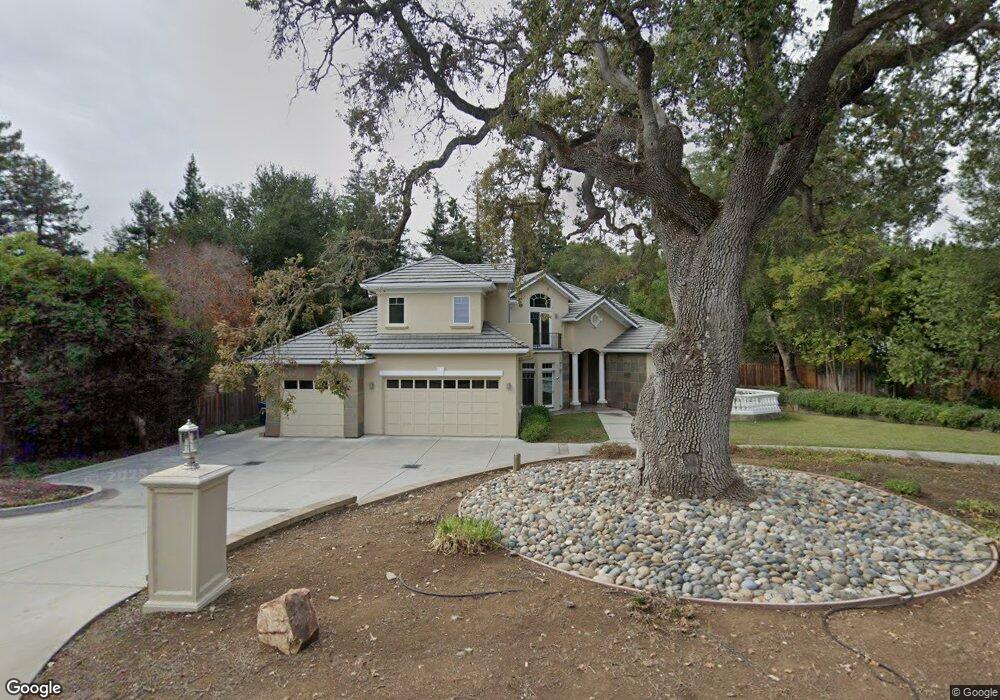
420 Cypress Dr Los Altos, CA 94022
Estimated Value: $8,615,000 - $10,319,404
5
Beds
7
Baths
8,100
Sq Ft
$1,146/Sq Ft
Est. Value
About This Home
This home is located at 420 Cypress Dr, Los Altos, CA 94022 and is currently estimated at $9,280,135, approximately $1,145 per square foot. 420 Cypress Dr is a home located in Santa Clara County with nearby schools including Gardner Bullis Elementary School, Ardis G. Egan Junior High School, and Los Altos High School.
Ownership History
Date
Name
Owned For
Owner Type
Purchase Details
Closed on
Jul 1, 2004
Sold by
Theis Robert I and Theis Mary R
Bought by
Theis Robert I and Theis Mary Rose
Current Estimated Value
Purchase Details
Closed on
Mar 26, 2001
Sold by
Paoli Thomas L and Paoli Brenda E
Bought by
Theis Robert I and Theis Mary R
Home Financials for this Owner
Home Financials are based on the most recent Mortgage that was taken out on this home.
Original Mortgage
$1,000,000
Outstanding Balance
$369,736
Interest Rate
7.06%
Estimated Equity
$8,910,399
Purchase Details
Closed on
Dec 2, 1998
Sold by
Orge Didier J and Rogez Isabelle J
Bought by
Paoli Thomas L and Paoli Brenda E
Purchase Details
Closed on
Nov 15, 1995
Sold by
Paoli Thomas L and Paoli Brenda E
Bought by
Paoli Thomas L and Paoli Brenda E
Create a Home Valuation Report for This Property
The Home Valuation Report is an in-depth analysis detailing your home's value as well as a comparison with similar homes in the area
Home Values in the Area
Average Home Value in this Area
Purchase History
| Date | Buyer | Sale Price | Title Company |
|---|---|---|---|
| Theis Robert I | -- | -- | |
| Theis Robert I | -- | Financial Title Company | |
| Paoli Thomas L | -- | First American Title Guarant | |
| Paoli Thomas L | -- | -- | |
| Paoli Thomas L | -- | -- |
Source: Public Records
Mortgage History
| Date | Status | Borrower | Loan Amount |
|---|---|---|---|
| Open | Theis Robert I | $1,000,000 |
Source: Public Records
Tax History Compared to Growth
Tax History
| Year | Tax Paid | Tax Assessment Tax Assessment Total Assessment is a certain percentage of the fair market value that is determined by local assessors to be the total taxable value of land and additions on the property. | Land | Improvement |
|---|---|---|---|---|
| 2025 | $62,683 | $5,474,366 | $3,012,195 | $2,462,171 |
| 2024 | $62,683 | $5,367,027 | $2,953,133 | $2,413,894 |
| 2023 | $62,087 | $5,261,792 | $2,895,229 | $2,366,563 |
| 2022 | $61,441 | $5,158,620 | $2,838,460 | $2,320,160 |
| 2021 | $61,768 | $5,057,471 | $2,782,804 | $2,274,667 |
| 2020 | $62,206 | $5,005,614 | $2,754,270 | $2,251,344 |
| 2019 | $59,035 | $4,907,465 | $2,700,265 | $2,207,200 |
| 2018 | $58,376 | $4,811,241 | $2,647,319 | $2,163,922 |
| 2017 | $56,103 | $4,716,904 | $2,595,411 | $2,121,493 |
| 2016 | $54,898 | $4,624,417 | $2,544,521 | $2,079,896 |
| 2015 | $54,137 | $4,554,955 | $2,506,300 | $2,048,655 |
| 2014 | $53,425 | $4,465,731 | $2,457,206 | $2,008,525 |
Source: Public Records
Map
Nearby Homes
- 226 W Edith Ave Unit 13
- 25285 W Fremont Rd
- 271 Stratford Place
- 26939 Beatrice Ln
- 101 2nd St Unit 2
- 101 2nd St Unit 5
- 86 3rd St Unit 203
- 13961 Fremont Pines Ln
- 130 Garland Way
- 26960 Orchard Hill Ln
- 14423 Miranda Ct
- 108 Coronado Ave
- 240 3rd St Unit 301
- 61 Sylvian Way
- 389 1st St Unit 14
- 389 1st St Unit 31
- 156 Beverly Ln
- 425 1st St Unit 23
- 425 1st St Unit 31
- 425 1st St Unit 24
- 412 Cypress Dr
- 3 Cypress Ct
- 1 Cypress Ct
- 430 Cypress Dr
- 5 Cypress Ct
- 400 Cypress Dr
- 410 Monterey Place
- 7 Cypress Ct
- 391 Cypress Dr
- 6 Cypress Ct
- 425 Monterey Place
- 406 Monterey Place
- 9 Cypress Ct
- 13901 W Edith Ave
- 389 Cypress Dr
- 394 W Edith Ave
- 25617 W Fremont Rd
- 415 Monterey Place
- 387 Warec Way
- 441 Cypress Dr