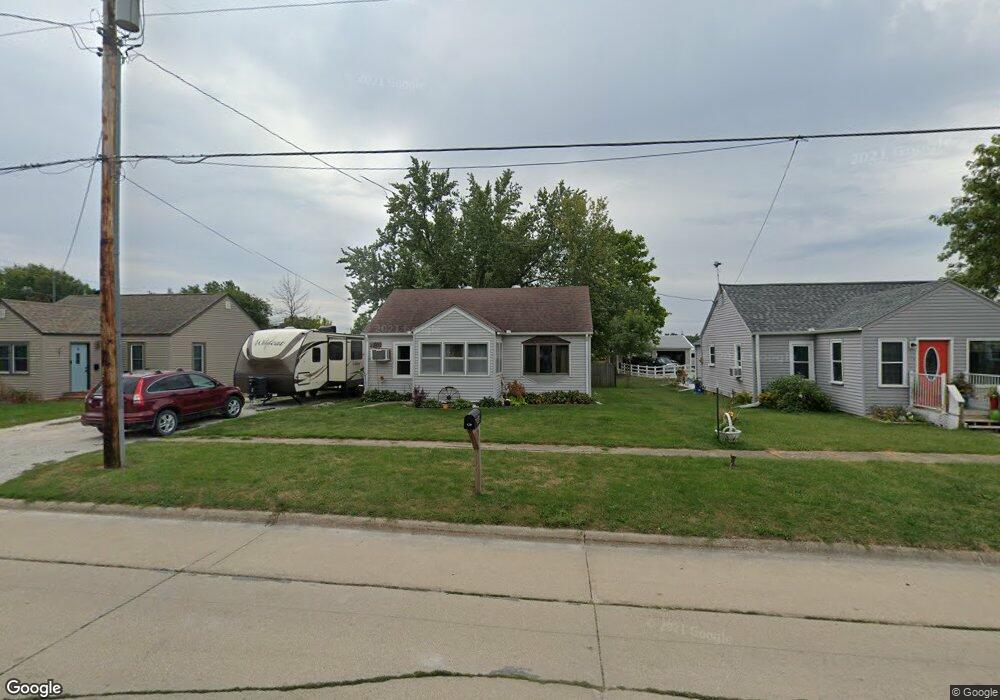
420 E Clay St Osceola, IA 50213
Estimated Value: $145,779 - $157,000
3
Beds
2
Baths
1,620
Sq Ft
$95/Sq Ft
Est. Value
About This Home
This home is located at 420 E Clay St, Osceola, IA 50213 and is currently estimated at $153,445, approximately $94 per square foot. 420 E Clay St is a home located in Clarke County with nearby schools including Clarke Community Elementary School, Clarke Middle School, and Clarke Community High School.
Ownership History
Date
Name
Owned For
Owner Type
Purchase Details
Closed on
Nov 5, 2013
Sold by
Danley Cory J and Danley Carrie A
Bought by
Hawxby Jerald and Hawxby Shelby
Current Estimated Value
Home Financials for this Owner
Home Financials are based on the most recent Mortgage that was taken out on this home.
Original Mortgage
$84,370
Outstanding Balance
$62,944
Interest Rate
4.24%
Mortgage Type
New Conventional
Estimated Equity
$90,501
Purchase Details
Closed on
May 17, 2010
Sold by
Abbas Tony L and Abbas Brandy L
Bought by
Danley Cory J and Danley Carrie A
Home Financials for this Owner
Home Financials are based on the most recent Mortgage that was taken out on this home.
Original Mortgage
$63,000
Interest Rate
5.3%
Mortgage Type
New Conventional
Create a Home Valuation Report for This Property
The Home Valuation Report is an in-depth analysis detailing your home's value as well as a comparison with similar homes in the area
Home Values in the Area
Average Home Value in this Area
Purchase History
| Date | Buyer | Sale Price | Title Company |
|---|---|---|---|
| Hawxby Jerald | $83,500 | None Available | |
| Danley Cory J | $80,000 | -- |
Source: Public Records
Mortgage History
| Date | Status | Borrower | Loan Amount |
|---|---|---|---|
| Open | Hawxby Jerald | $84,370 | |
| Previous Owner | Danley Cory J | $63,000 |
Source: Public Records
Tax History Compared to Growth
Tax History
| Year | Tax Paid | Tax Assessment Tax Assessment Total Assessment is a certain percentage of the fair market value that is determined by local assessors to be the total taxable value of land and additions on the property. | Land | Improvement |
|---|---|---|---|---|
| 2024 | $2,086 | $109,260 | $15,260 | $94,000 |
| 2023 | $2,530 | $109,260 | $15,260 | $94,000 |
| 2022 | $2,424 | $116,200 | $14,400 | $101,800 |
| 2021 | $2,144 | $97,440 | $12,080 | $85,360 |
| 2020 | $2,082 | $97,440 | $12,080 | $85,360 |
| 2019 | $2,374 | $97,440 | $0 | $0 |
| 2018 | $2,308 | $97,440 | $0 | $0 |
| 2017 | $2,218 | $89,390 | $0 | $0 |
| 2016 | $2,188 | $89,390 | $0 | $0 |
| 2014 | $2,070 | $70,970 | $0 | $0 |
Source: Public Records
Map
Nearby Homes
- 213 N Adams St
- 219 N East St
- 119 N Park St
- 131 N Park St
- 220 Eastside Dr
- 303 S Dewey St
- 117 W Logan St
- 718 Roosevelt Blvd
- 601 N Main St
- 215 W Clay St
- 213 W Logan St
- 214 W Jefferson St
- 000 Kendall St
- 115 W Mclane St
- 114 E Grant St
- 321 W Clay St
- 116 W Grant St
- 215 N Lincoln St
- 101 N Lincoln St
- 322 S Temple St