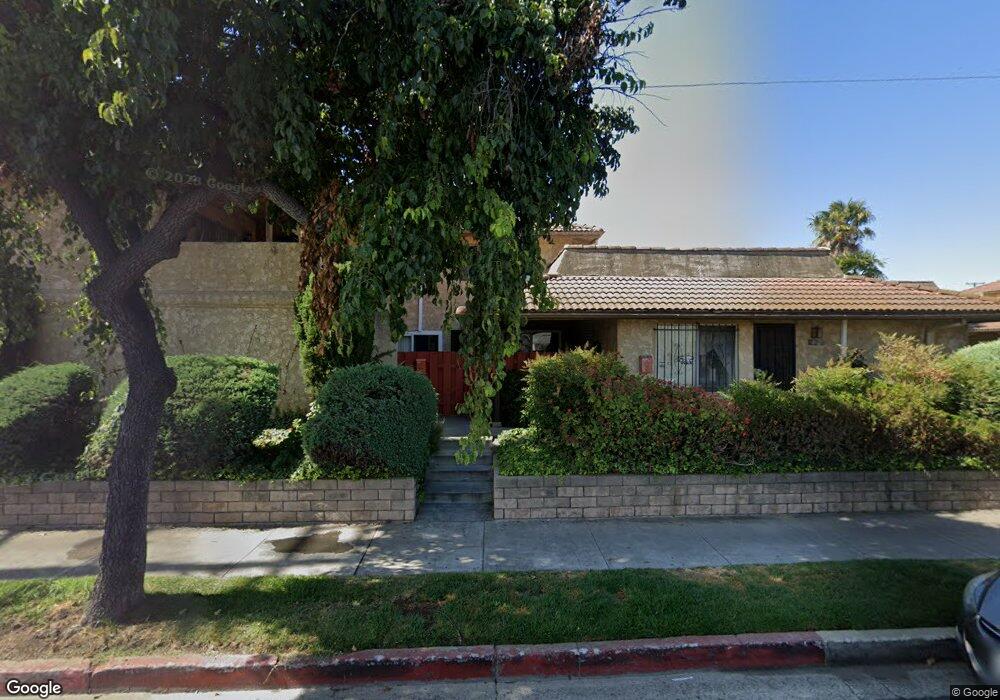
420 E Newmark Ave Unit F Monterey Park, CA 91755
Estimated Value: $555,941 - $678,000
2
Beds
2
Baths
1,040
Sq Ft
$609/Sq Ft
Est. Value
About This Home
This home is located at 420 E Newmark Ave Unit F, Monterey Park, CA 91755 and is currently estimated at $633,485, approximately $609 per square foot. 420 E Newmark Ave Unit F is a home located in Los Angeles County with nearby schools including Monterey Vista Elementary School, Garvey (Richard) Intermediate School, and Mark Keppel High School.
Ownership History
Date
Name
Owned For
Owner Type
Purchase Details
Closed on
Dec 19, 2017
Sold by
Chu Brandon Akito
Bought by
Chu David Chwin Win and Chu Yasuko
Current Estimated Value
Purchase Details
Closed on
Jul 7, 2016
Sold by
Eguchi Joyce E
Bought by
Chu Brandon Akito
Purchase Details
Closed on
Sep 5, 2003
Sold by
Nishimura Mie Helen
Bought by
Nishimura Mie Helen and Mie Helen Nishimura 1995 Revocable Livin
Home Financials for this Owner
Home Financials are based on the most recent Mortgage that was taken out on this home.
Original Mortgage
$125,000
Interest Rate
5.87%
Mortgage Type
Purchase Money Mortgage
Purchase Details
Closed on
Jul 31, 2003
Sold by
Deleon Ann
Bought by
Nishimura Mie Helen
Home Financials for this Owner
Home Financials are based on the most recent Mortgage that was taken out on this home.
Original Mortgage
$125,000
Interest Rate
5.87%
Mortgage Type
Purchase Money Mortgage
Create a Home Valuation Report for This Property
The Home Valuation Report is an in-depth analysis detailing your home's value as well as a comparison with similar homes in the area
Home Values in the Area
Average Home Value in this Area
Purchase History
| Date | Buyer | Sale Price | Title Company |
|---|---|---|---|
| Chu David Chwin Win | -- | Fidelity Sherman Oaks | |
| Chu Brandon Akito | $332,000 | Fidelity Sherman Oaks | |
| Nishimura Mie Helen | -- | -- | |
| Nishimura Mie Helen | $195,000 | Southland Title Company |
Source: Public Records
Mortgage History
| Date | Status | Borrower | Loan Amount |
|---|---|---|---|
| Previous Owner | Nishimura Mie Helen | $125,000 |
Source: Public Records
Tax History Compared to Growth
Tax History
| Year | Tax Paid | Tax Assessment Tax Assessment Total Assessment is a certain percentage of the fair market value that is determined by local assessors to be the total taxable value of land and additions on the property. | Land | Improvement |
|---|---|---|---|---|
| 2025 | $5,306 | $384,960 | $227,124 | $157,836 |
| 2024 | $5,306 | $377,413 | $222,671 | $154,742 |
| 2023 | $5,129 | $370,013 | $218,305 | $151,708 |
| 2022 | $4,897 | $362,759 | $214,025 | $148,734 |
| 2021 | $4,873 | $355,647 | $209,829 | $145,818 |
| 2019 | $4,692 | $345,100 | $203,606 | $141,494 |
| 2018 | $4,664 | $338,334 | $199,614 | $138,720 |
| 2017 | $4,595 | $331,700 | $195,700 | $136,000 |
| 2016 | $3,084 | $234,194 | $133,552 | $100,642 |
| 2015 | $3,023 | $230,677 | $131,546 | $99,131 |
| 2014 | $2,985 | $226,160 | $128,970 | $97,190 |
Source: Public Records
Map
Nearby Homes
- 424 E Newmark Ave Unit B
- 412 E Newmark Ave Unit D
- 400 S Alhambra Ave
- 112 S Sierra Vista St
- 514 S Alhambra Ave Unit 3
- 439 S Orange Ave Unit F
- 519 Sefton Ave Unit D
- 531 Sefton Ave
- 719 E Mabel Ave
- 123 N Alhambra Ave Unit D
- 418 S Lincoln Ave
- 607 Sefton Ave
- 825 E Newmark Ave Unit A
- 524 E Graves Ave Unit A
- 346 E Graves Ave
- 208 N Nicholson Ave Unit B
- 203 N Nicholson Ave
- 197 N Nicholson Ave
- 527 Pomelo Ave Unit E
- 230 N Nicholson Ave Unit C
- 414 E Newmark Ave
- 410 E Newmark Ave Unit D
- 410 E Newmark Ave Unit C
- 410 E Newmark Ave
- 410 E Newmark Ave Unit A
- 414 E Newmark Ave Unit F
- 414 E Newmark Ave Unit E
- 414 E Newmark Ave Unit D
- 414 E Newmark Ave Unit C
- 414 E Newmark Ave Unit B
- 414 E Newmark Ave Unit A
- 410 E Newmark Ave Unit F
- 410 E Newmark Ave Unit E
- 420 E Newmark Ave Unit A
- 420 E Newmark Ave Unit B
- 420 E Newmark Ave Unit C
- 420 E Newmark Ave Unit D
- 420 E Newmark Ave Unit E
- 424 E Newmark Ave Unit E
- 424 E Newmark Ave Unit F