

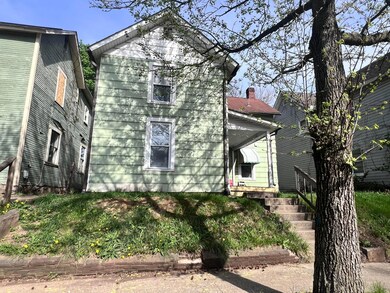
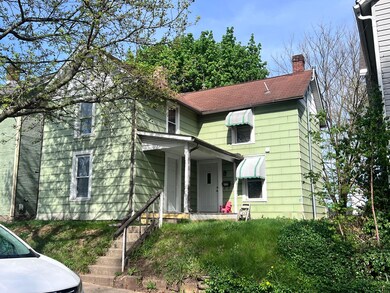
420 Harrison Ave Lancaster, OH 43130
4
Beds
1
Bath
1,236
Sq Ft
5,227
Sq Ft Lot
About This Home
As of July 2025This home is located at 420 Harrison Ave, Lancaster, OH 43130 and is currently priced at $125,500, approximately $101 per square foot. This property was built in 1900. 420 Harrison Ave is a home located in Fairfield County with nearby schools including General Sherman Junior High School, Lancaster High School, and St Mary Elementary School.
Last Agent to Sell the Property
Century 21 Darfus Realty License #201902167 Listed on: 07/14/2025
Home Details
Home Type
- Single Family
Est. Annual Taxes
- $972
Year Built
- Built in 1900
Lot Details
- 5,227 Sq Ft Lot
Home Design
- Traditional Architecture
- Block Foundation
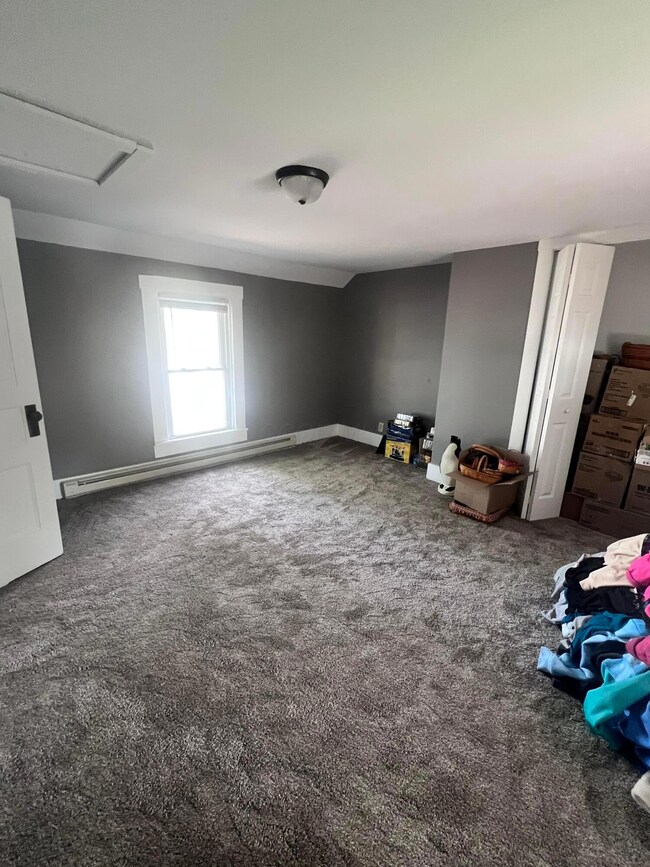
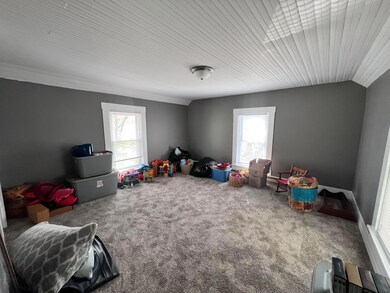
Interior Spaces
- 1,236 Sq Ft Home
- 2-Story Property
- Partial Basement
Bedrooms and Bathrooms
- 1 Full Bathroom
Parking
- No Garage
- On-Street Parking
Listing and Financial Details
- Assessor Parcel Number 05-31063-400
Ownership History
Date
Name
Owned For
Owner Type
Purchase Details
Listed on
Jan 29, 2025
Closed on
Mar 7, 2025
Sold by
My Freedom Properties Llc and Herman Family Trust
Bought by
Williams Vicky A
Seller's Agent
Delene McNeal
Real of Ohio
Buyer's Agent
Audrey Barr
CRT, Realtors
List Price
$119,900
Sold Price
$110,000
Premium/Discount to List
-$9,900
-8.26%
Views
29
Home Financials for this Owner
Home Financials are based on the most recent Mortgage that was taken out on this home.
Avg. Annual Appreciation
8.20%
Original Mortgage
$98,000
Outstanding Balance
$97,673
Interest Rate
6.95%
Mortgage Type
New Conventional
Estimated Equity
$15,405
Purchase Details
Listed on
Sep 26, 2019
Closed on
Feb 20, 2020
Sold by
Miller Scott and Miller Autumn
Bought by
My Freedom Properties Llc
Seller's Agent
Jodi Bird
Howard HannaRealEstateServices
Buyer's Agent
Jodi Bird
Howard HannaRealEstateServices
List Price
$65,000
Sold Price
$55,000
Premium/Discount to List
-$10,000
-15.38%
Home Financials for this Owner
Home Financials are based on the most recent Mortgage that was taken out on this home.
Avg. Annual Appreciation
14.71%
Original Mortgage
$44,000
Interest Rate
3.6%
Mortgage Type
Future Advance Clause Open End Mortgage
Purchase Details
Listed on
Jul 29, 2018
Closed on
Aug 22, 2018
Sold by
Lambert George D
Bought by
Miller Scott and Miller Autumn
Seller's Agent
Kevin Ours
Transaction Realty
Buyer's Agent
Jodi Bird
Howard HannaRealEstateServices
List Price
$39,900
Sold Price
$35,900
Premium/Discount to List
-$4,000
-10.03%
Home Financials for this Owner
Home Financials are based on the most recent Mortgage that was taken out on this home.
Avg. Annual Appreciation
32.90%
Purchase Details
Closed on
Jul 31, 1997
Sold by
Hollingsworth Charles
Bought by
George D Lambert
Similar Homes in Lancaster, OH
Create a Home Valuation Report for This Property
The Home Valuation Report is an in-depth analysis detailing your home's value as well as a comparison with similar homes in the area
Home Values in the Area
Average Home Value in this Area
Purchase History
| Date | Type | Sale Price | Title Company |
|---|---|---|---|
| Warranty Deed | $110,000 | Valmer Land Title | |
| Warranty Deed | $55,000 | First Ohio Title Insurance | |
| Warranty Deed | $35,900 | Chicago Title | |
| Affidavit Of Death Of Life Tenant | -- | Chicago Title | |
| Deed | $32,760 | -- |
Source: Public Records
Mortgage History
| Date | Status | Loan Amount | Loan Type |
|---|---|---|---|
| Open | $98,000 | New Conventional | |
| Previous Owner | $44,000 | Future Advance Clause Open End Mortgage |
Source: Public Records
Property History
| Date | Event | Price | Change | Sq Ft Price |
|---|---|---|---|---|
| 07/14/2025 07/14/25 | For Sale | $119,900 | -4.5% | $97 / Sq Ft |
| 07/11/2025 07/11/25 | Sold | $125,500 | +128.2% | $102 / Sq Ft |
| 04/26/2025 04/26/25 | Pending | -- | -- | -- |
| 03/31/2025 03/31/25 | Off Market | $55,000 | -- | -- |
| 03/31/2025 03/31/25 | Off Market | $35,900 | -- | -- |
| 03/27/2025 03/27/25 | Off Market | $55,000 | -- | -- |
| 03/14/2025 03/14/25 | Off Market | $1,300 | -- | -- |
| 03/11/2025 03/11/25 | Sold | $110,000 | 0.0% | $89 / Sq Ft |
| 02/10/2025 02/10/25 | Off Market | -- | -- | -- |
| 02/06/2025 02/06/25 | For Rent | $1,300 | 0.0% | -- |
| 01/29/2025 01/29/25 | For Sale | $119,900 | 0.0% | $97 / Sq Ft |
| 01/21/2025 01/21/25 | For Rent | -- | -- | -- |
| 01/16/2025 01/16/25 | Off Market | $110,000 | -- | -- |
| 01/10/2025 01/10/25 | For Rent | $1,300 | 0.0% | -- |
| 12/01/2024 12/01/24 | Price Changed | $119,900 | -4.0% | $97 / Sq Ft |
| 11/19/2024 11/19/24 | For Sale | $124,900 | +127.1% | $101 / Sq Ft |
| 02/21/2020 02/21/20 | Sold | $55,000 | -15.4% | $44 / Sq Ft |
| 02/01/2020 02/01/20 | For Sale | $65,000 | 0.0% | $53 / Sq Ft |
| 02/01/2020 02/01/20 | Pending | -- | -- | -- |
| 12/14/2019 12/14/19 | Price Changed | $65,000 | -13.3% | $53 / Sq Ft |
| 11/07/2019 11/07/19 | Price Changed | $75,000 | -6.3% | $61 / Sq Ft |
| 10/30/2019 10/30/19 | Price Changed | $80,000 | -5.9% | $65 / Sq Ft |
| 10/09/2019 10/09/19 | Price Changed | $85,000 | -4.5% | $69 / Sq Ft |
| 10/02/2019 10/02/19 | Price Changed | $89,000 | -2.1% | $72 / Sq Ft |
| 09/26/2019 09/26/19 | For Sale | $90,900 | +153.2% | $74 / Sq Ft |
| 08/22/2018 08/22/18 | Sold | $35,900 | -10.0% | $29 / Sq Ft |
| 07/29/2018 07/29/18 | For Sale | $39,900 | -- | $32 / Sq Ft |
Source: Columbus and Central Ohio Regional MLS
Tax History Compared to Growth
Tax History
| Year | Tax Paid | Tax Assessment Tax Assessment Total Assessment is a certain percentage of the fair market value that is determined by local assessors to be the total taxable value of land and additions on the property. | Land | Improvement |
|---|---|---|---|---|
| 2024 | $2,206 | $24,540 | $5,390 | $19,150 |
| 2023 | $912 | $24,540 | $5,390 | $19,150 |
| 2022 | $917 | $24,540 | $5,390 | $19,150 |
| 2021 | $741 | $18,580 | $5,390 | $13,190 |
| 2020 | $745 | $18,580 | $5,390 | $13,190 |
| 2019 | $677 | $18,580 | $5,390 | $13,190 |
| 2018 | $294 | $20,380 | $5,390 | $14,990 |
| 2017 | $294 | $19,630 | $5,390 | $14,240 |
| 2016 | $275 | $19,630 | $5,390 | $14,240 |
| 2015 | $300 | $19,710 | $5,390 | $14,320 |
| 2014 | $265 | $19,710 | $5,390 | $14,320 |
| 2013 | $265 | $19,710 | $5,390 | $14,320 |
Source: Public Records
Agents Affiliated with this Home
-
SHAWNA LINN
Seller's Agent in 2025
SHAWNA LINN
Century 21 Darfus Realty
(740) 304-4910
20 in this area
60 Total Sales
-
Delene McNeal
Seller's Agent in 2025
Delene McNeal
Real of Ohio
(614) 561-7836
68 in this area
114 Total Sales
-
Jacqueline Miller
J
Buyer's Agent in 2025
Jacqueline Miller
Century 21 Darfus Realty
(740) 215-2345
1 in this area
2 Total Sales
-
Audrey Barr
Buyer's Agent in 2025
Audrey Barr
CRT, Realtors
(740) 974-2973
38 in this area
114 Total Sales
-
Jodi Bird
Seller's Agent in 2020
Jodi Bird
Howard HannaRealEstateServices
(740) 407-2408
17 in this area
32 Total Sales
-
K
Seller's Agent in 2018
Kevin Ours
Transaction Realty
Map
Source: Columbus and Central Ohio Regional MLS
MLS Number: 225025929
APN: 05-31063-400
Disclaimer: Certain information contained herein is derived from information provided by parties other than Homes.com. All information provided is deemed reliable, but is not guaranteed to be accurate and should be independently verified.
![]() IDX information is provided exclusively for personal, non-commercial use, and may not be used for any purpose other than to identify prospective properties consumers may be interested in purchasing.
IDX information is provided exclusively for personal, non-commercial use, and may not be used for any purpose other than to identify prospective properties consumers may be interested in purchasing.
Information is deemed reliable but not guaranteed.
Nearby Homes
- 224 Harrison Ave
- 633 Washington Ave
- 610 W Wheeling St
- 1202 W Mulberry St
- 410 Ogara Ave
- 1214 W Mulberry St
- 205 Sherman Ave
- 1011 8th Ave Unit 1013
- 520 W Main St
- 112 N George St
- 108 N George St
- 1120 8th Ave
- 1228 8th Ave
- 703 N Roosevelt Ave
- 317 Busby Ave
- 0 Jefferson Ave Unit 225017117
- 520 Maud Ave
- 956 Harrison Ave
- 114 S Cedar Ave
- 1000 Goodwin Ave