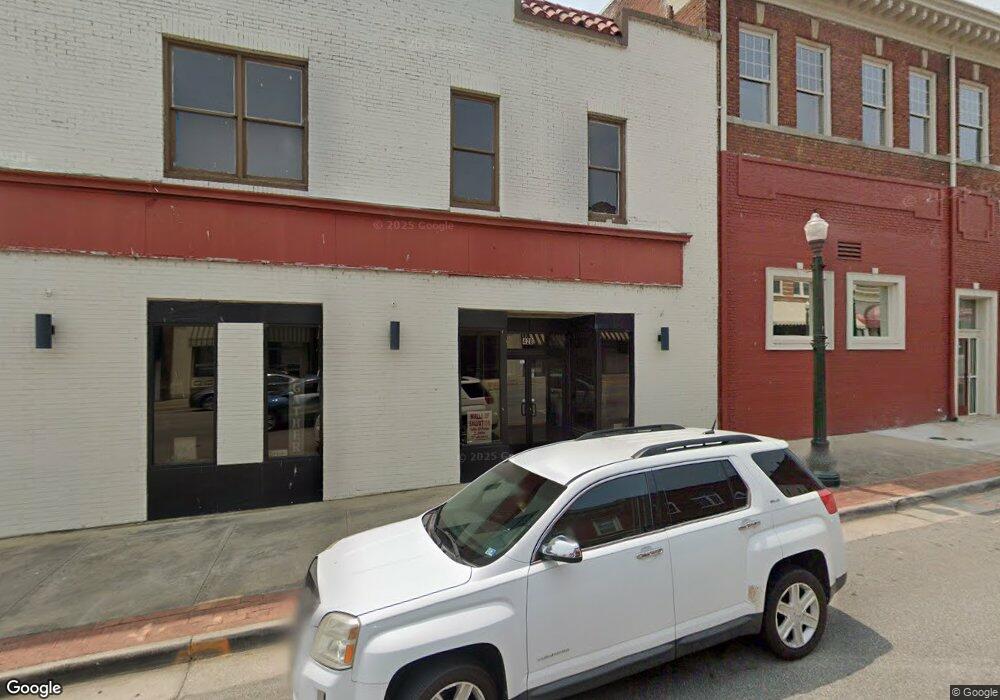
420 Main St South Boston, VA 24592
Estimated Value: $330,381
--
Bed
2
Baths
7,000
Sq Ft
$47/Sq Ft
Est. Value
About This Home
This home is located at 420 Main St, South Boston, VA 24592 and is currently estimated at $330,381, approximately $47 per square foot. 420 Main St is a home located in Halifax County with nearby schools including South Boston Elementary School, Halifax County Middle School, and Halifax County High School.
Ownership History
Date
Name
Owned For
Owner Type
Purchase Details
Closed on
Dec 13, 2022
Sold by
Fountain Gerald
Bought by
Industrial Development Authority Of The Town
Current Estimated Value
Create a Home Valuation Report for This Property
The Home Valuation Report is an in-depth analysis detailing your home's value as well as a comparison with similar homes in the area
Home Values in the Area
Average Home Value in this Area
Purchase History
| Date | Buyer | Sale Price | Title Company |
|---|---|---|---|
| Industrial Development Authority Of The Town | $280,000 | Fidelity National Title |
Source: Public Records
Tax History Compared to Growth
Tax History
| Year | Tax Paid | Tax Assessment Tax Assessment Total Assessment is a certain percentage of the fair market value that is determined by local assessors to be the total taxable value of land and additions on the property. | Land | Improvement |
|---|---|---|---|---|
| 2025 | $2,037 | $407,332 | $35,400 | $371,932 |
| 2024 | $2,037 | $407,332 | $35,400 | $371,932 |
| 2023 | $1,487 | $297,495 | $35,400 | $262,095 |
| 2022 | $1,487 | $297,495 | $35,400 | $262,095 |
| 2021 | $1,487 | $297,495 | $35,400 | $262,095 |
| 2020 | $1,487 | $297,495 | $35,400 | $262,095 |
| 2019 | $1,487 | $297,485 | $35,390 | $262,095 |
| 2018 | $1,428 | $297,485 | $35,390 | $262,095 |
| 2016 | $923 | $192,280 | $49,500 | $142,780 |
| 2015 | $923 | $192,056 | $49,500 | $142,556 |
| 2014 | $814 | $176,883 | $35,195 | $141,688 |
| 2013 | $807 | $179,245 | $35,195 | $144,050 |
Source: Public Records
Map
Nearby Homes
- 301 Ragland St
- 622 N Main St
- 1340 Jeffress St
- 305 Ellyson Ave
- 901 Washington Ave
- 3 Lots Seymour Dr
- 1400 Fenton St
- 1411 Fenton St
- 1014 Washington Ave
- 0.7 AC Randolph Ave
- 1323 Irish St
- 315 Edmunds St
- 1329 Hodges St
- 1017 South Ave
- 1612 Irish St
- 1010 Marshall Ave
- 1204 South Ave
- 000 Huell Matthews Hwy
- 800 Easley St
- 1312 Peach Ave