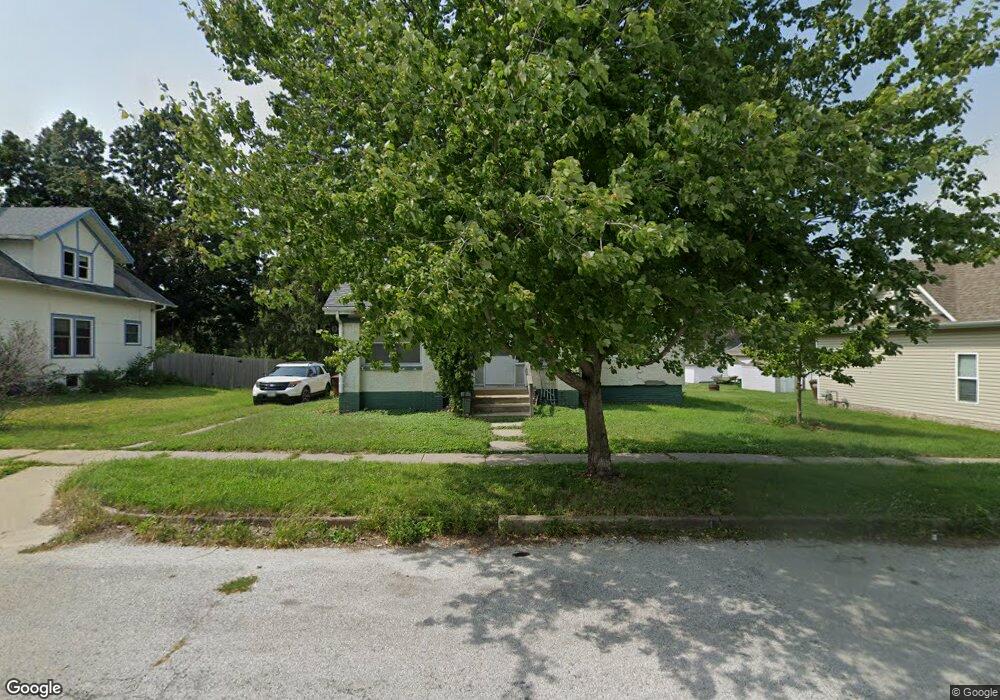
420 Maxwell St Maxwell, IA 50161
Estimated Value: $159,000 - $172,000
3
Beds
1
Bath
1,416
Sq Ft
$118/Sq Ft
Est. Value
About This Home
This home is located at 420 Maxwell St, Maxwell, IA 50161 and is currently estimated at $166,809, approximately $117 per square foot. 420 Maxwell St is a home located in Story County with nearby schools including Collins-Maxwell Elementary School and Collins-Maxwell Middle/High School.
Ownership History
Date
Name
Owned For
Owner Type
Purchase Details
Closed on
May 24, 2007
Sold by
Federal National Mortgage Association
Bought by
Jordan Water A
Current Estimated Value
Home Financials for this Owner
Home Financials are based on the most recent Mortgage that was taken out on this home.
Original Mortgage
$76,000
Outstanding Balance
$46,103
Interest Rate
6.21%
Mortgage Type
New Conventional
Estimated Equity
$120,706
Create a Home Valuation Report for This Property
The Home Valuation Report is an in-depth analysis detailing your home's value as well as a comparison with similar homes in the area
Home Values in the Area
Average Home Value in this Area
Purchase History
| Date | Buyer | Sale Price | Title Company |
|---|---|---|---|
| Jordan Water A | -- | -- |
Source: Public Records
Mortgage History
| Date | Status | Borrower | Loan Amount |
|---|---|---|---|
| Open | Jordan Water A | $76,000 |
Source: Public Records
Tax History Compared to Growth
Tax History
| Year | Tax Paid | Tax Assessment Tax Assessment Total Assessment is a certain percentage of the fair market value that is determined by local assessors to be the total taxable value of land and additions on the property. | Land | Improvement |
|---|---|---|---|---|
| 2025 | $1,974 | $141,700 | $28,100 | $113,600 |
| 2024 | $1,936 | $133,800 | $26,300 | $107,500 |
| 2023 | $2,010 | $133,800 | $26,300 | $107,500 |
| 2022 | $2,040 | $113,400 | $26,300 | $87,100 |
| 2021 | $1,948 | $113,400 | $26,300 | $87,100 |
| 2020 | $1,730 | $103,200 | $13,900 | $89,300 |
| 2019 | $1,730 | $103,200 | $13,900 | $89,300 |
| 2018 | $1,372 | $89,400 | $13,900 | $75,500 |
| 2017 | $1,372 | $89,400 | $13,900 | $75,500 |
| 2016 | $1,238 | $78,900 | $11,300 | $67,600 |
| 2015 | $1,238 | $78,900 | $11,300 | $67,600 |
| 2014 | $1,172 | $77,100 | $12,000 | $65,100 |
Source: Public Records
Map
Nearby Homes