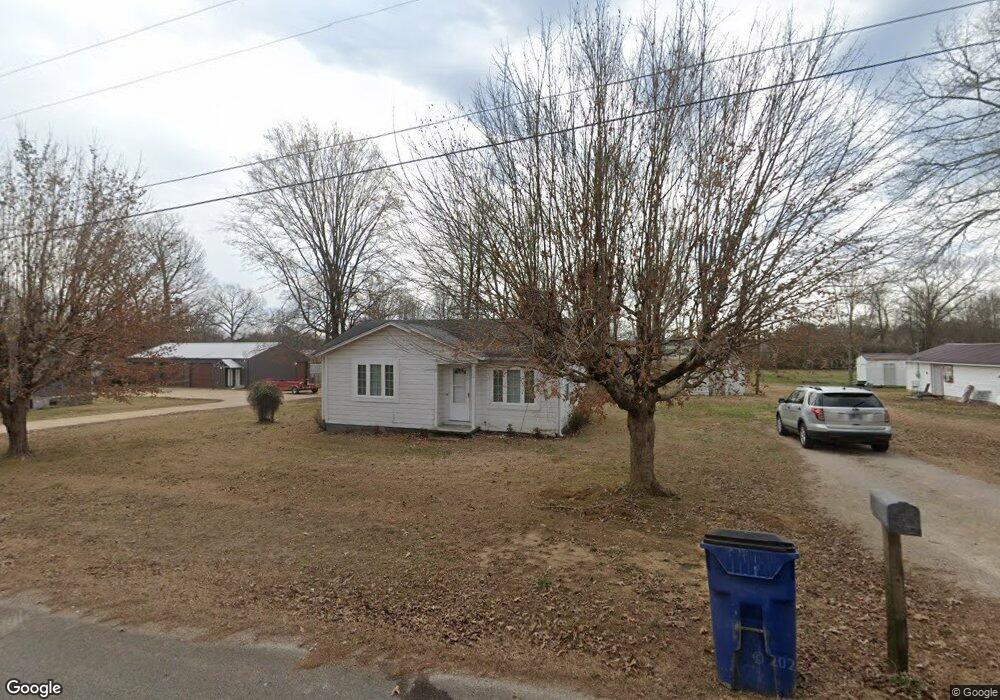
420 Park St Savannah, TN 38372
Estimated Value: $74,000 - $96,000
--
Bed
1
Bath
750
Sq Ft
$111/Sq Ft
Est. Value
About This Home
This home is located at 420 Park St, Savannah, TN 38372 and is currently estimated at $83,450, approximately $111 per square foot. 420 Park St is a home located in Hardin County with nearby schools including Hardin County High School and Hardin County Christian School.
Ownership History
Date
Name
Owned For
Owner Type
Purchase Details
Closed on
Aug 27, 2021
Sold by
Joiner Linda D
Bought by
Linville Justin
Current Estimated Value
Home Financials for this Owner
Home Financials are based on the most recent Mortgage that was taken out on this home.
Original Mortgage
$42,500
Outstanding Balance
$8,982
Interest Rate
2.8%
Mortgage Type
Purchase Money Mortgage
Estimated Equity
$74,468
Purchase Details
Closed on
Jun 9, 2021
Sold by
Russell Linda
Bought by
Joiner Linda D
Purchase Details
Closed on
Aug 21, 1989
Bought by
Russell Linda
Purchase Details
Closed on
Jun 22, 1966
Bought by
Dickson Dickson M and Dickson Mildred
Create a Home Valuation Report for This Property
The Home Valuation Report is an in-depth analysis detailing your home's value as well as a comparison with similar homes in the area
Home Values in the Area
Average Home Value in this Area
Purchase History
| Date | Buyer | Sale Price | Title Company |
|---|---|---|---|
| Linville Justin | $50,000 | None Available | |
| Joiner Linda D | $20,000 | None Available | |
| Russell Linda | -- | -- | |
| Dickson Dickson M | -- | -- |
Source: Public Records
Mortgage History
| Date | Status | Borrower | Loan Amount |
|---|---|---|---|
| Open | Linville Justin | $42,500 |
Source: Public Records
Tax History Compared to Growth
Tax History
| Year | Tax Paid | Tax Assessment Tax Assessment Total Assessment is a certain percentage of the fair market value that is determined by local assessors to be the total taxable value of land and additions on the property. | Land | Improvement |
|---|---|---|---|---|
| 2024 | $428 | $17,475 | $3,500 | $13,975 |
| 2023 | $428 | $17,475 | $3,500 | $13,975 |
| 2022 | $244 | $8,850 | $2,850 | $6,000 |
| 2021 | $244 | $8,850 | $2,850 | $6,000 |
| 2020 | $244 | $8,850 | $2,850 | $6,000 |
| 2019 | $244 | $8,850 | $2,850 | $6,000 |
| 2018 | $238 | $8,850 | $2,850 | $6,000 |
| 2017 | $209 | $7,500 | $2,275 | $5,225 |
| 2016 | $209 | $7,500 | $2,275 | $5,225 |
| 2015 | $189 | $7,500 | $2,275 | $5,225 |
| 2014 | $189 | $7,500 | $2,275 | $5,225 |
Source: Public Records
Map
Nearby Homes
- 65 Walnut St
- 870 Main St E
- 635 Harbert Dr
- 115 Rb Dr
- 285 Thomas St
- 700 Harbert Dr
- 160 Harbert Dr
- 710 Main St E
- 165 Foursquare St
- 00 Squaw St
- 70 Red Fern Cove
- 80 Northcutt St
- 80 Quartet Cir
- 25 Northcutt St
- 134 Horse Creek Rd
- 250 Parkview Dr
- 190 Turner Kyle Dr
- 530 Main St E
- 295 Claybrook Dr
- 200 Hardin Rd