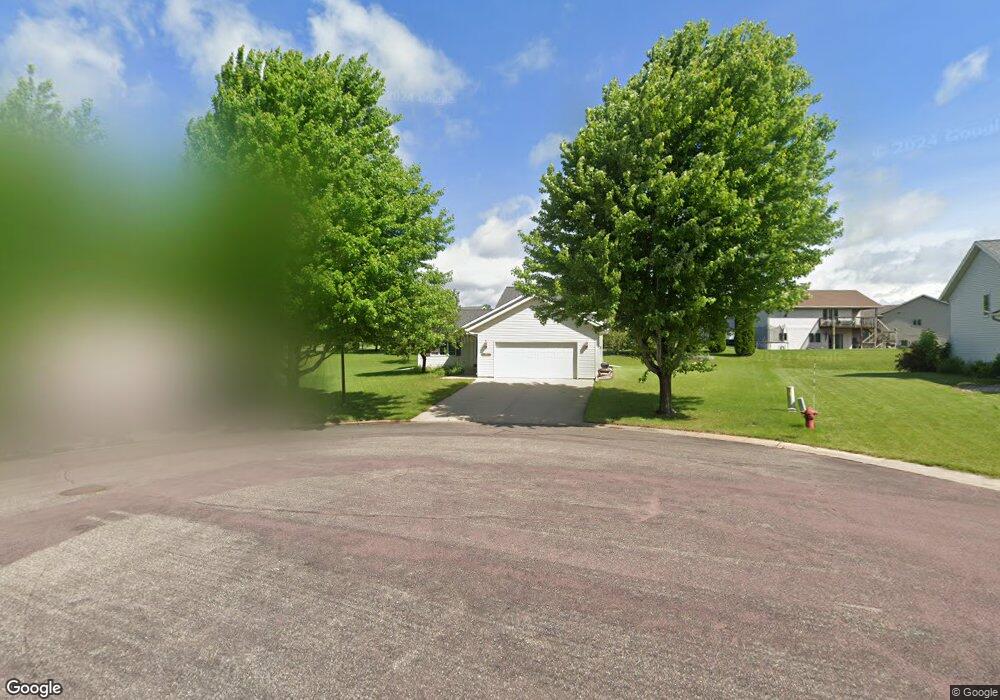
420 Pebble Ct Eagle Lake, MN 56024
Estimated Value: $302,000 - $354,000
3
Beds
1
Bath
1,255
Sq Ft
$269/Sq Ft
Est. Value
About This Home
This home is located at 420 Pebble Ct, Eagle Lake, MN 56024 and is currently estimated at $338,188, approximately $269 per square foot. 420 Pebble Ct is a home located in Blue Earth County with nearby schools including Eagle Lake Elementary School, Prairie Winds Middle School, and Mankato East Senior High School.
Ownership History
Date
Name
Owned For
Owner Type
Purchase Details
Closed on
Jan 20, 2021
Sold by
Ekstrom Douglas E and Ekstrom Michele Rae
Bought by
Ekstrom Douglas E and Ekstrom Michele Rae
Current Estimated Value
Create a Home Valuation Report for This Property
The Home Valuation Report is an in-depth analysis detailing your home's value as well as a comparison with similar homes in the area
Home Values in the Area
Average Home Value in this Area
Purchase History
| Date | Buyer | Sale Price | Title Company |
|---|---|---|---|
| Ekstrom Douglas E | -- | Stewart Title |
Source: Public Records
Tax History Compared to Growth
Tax History
| Year | Tax Paid | Tax Assessment Tax Assessment Total Assessment is a certain percentage of the fair market value that is determined by local assessors to be the total taxable value of land and additions on the property. | Land | Improvement |
|---|---|---|---|---|
| 2025 | $3,144 | $299,900 | $49,300 | $250,600 |
| 2024 | $3,144 | $289,000 | $49,400 | $239,600 |
| 2023 | $2,726 | $301,800 | $49,400 | $252,400 |
| 2022 | $2,704 | $254,200 | $49,400 | $204,800 |
| 2021 | $2,402 | $237,300 | $49,400 | $187,900 |
| 2020 | $2,432 | $219,000 | $48,900 | $170,100 |
| 2019 | $2,416 | $219,000 | $48,900 | $170,100 |
| 2018 | $2,268 | $219,100 | $48,900 | $170,200 |
| 2017 | $2,020 | $209,400 | $48,900 | $160,500 |
| 2016 | $2,012 | $189,800 | $48,900 | $140,900 |
| 2015 | $18 | $189,800 | $48,900 | $140,900 |
| 2014 | $1,878 | $167,300 | $48,900 | $118,400 |
Source: Public Records
Map
Nearby Homes
- 532 Le Sueur Ave
- 528 Linda Dr
- 409 Owl Ln
- 101 Hawk Ave
- 309 Falcon Run
- 306 Falcon Run
- 112 S 3rd St
- 112 St
- 121 Hawk Ave
- 220 220 Connie Ln
- 205 Peregrine Ave
- 104 Blace Ave
- 102 Gray Fox Path
- 101 Gray Fox Path
- 103 Gray Fox Path
- 105 105 Gray Fox Path
- 100 White Fox Path
- 102 White Fox Path
- 104 White Fox Path
- 101 White Fox Path
- 424 Pebble Ct
- 416 Pebble Ct
- 256 Creekside Dr
- 252 Creekside Dr
- 425 Pebble Ct
- 258 Creekside Dr
- 412 Pebble Ct
- 421 Pebble Ct
- 417 Pebble Ct
- 248 Creekside Dr
- 413 Pebble Ct
- 408 Pebble Ct
- 244 Creekside Dr
- 404 Pebble Ct
- 220 Rockwell Dr
- 241 Creekside Dr
- 21491 598th Ave
- 304 Brook Ct
- 308 Brook Ct
- 240 Creekside Dr