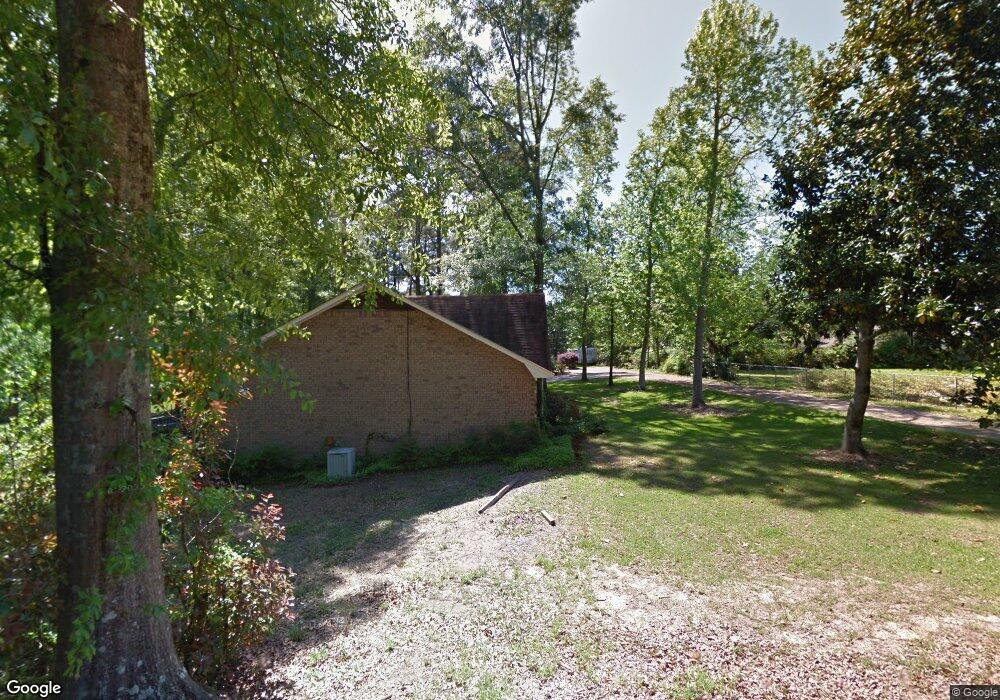
420 Pineview Dr Laurel, MS 39440
Estimated Value: $228,233 - $324,000
4
Beds
2
Baths
2,160
Sq Ft
$118/Sq Ft
Est. Value
About This Home
This home is located at 420 Pineview Dr, Laurel, MS 39440 and is currently estimated at $254,308, approximately $117 per square foot. 420 Pineview Dr is a home located in Jones County with nearby schools including Mason Elementary School, Laurel Middle School, and Laurel High School.
Ownership History
Date
Name
Owned For
Owner Type
Purchase Details
Closed on
Mar 30, 2009
Sold by
Hancock William A and Hancock Lori D
Bought by
Cooley Justin R and Cooley Jana S
Current Estimated Value
Home Financials for this Owner
Home Financials are based on the most recent Mortgage that was taken out on this home.
Original Mortgage
$131,081
Outstanding Balance
$83,036
Interest Rate
5.14%
Estimated Equity
$171,272
Purchase Details
Closed on
Jul 31, 2007
Sold by
Davis Brad and Davis Stacey E
Bought by
Hancock William A and Hancock Lori D
Home Financials for this Owner
Home Financials are based on the most recent Mortgage that was taken out on this home.
Original Mortgage
$122,550
Interest Rate
6.56%
Purchase Details
Closed on
Jul 28, 2006
Sold by
Bassett Chad B and Bassett Carla M
Bought by
Davis Stacey E and Davis Brad
Home Financials for this Owner
Home Financials are based on the most recent Mortgage that was taken out on this home.
Original Mortgage
$105,976
Interest Rate
6.74%
Create a Home Valuation Report for This Property
The Home Valuation Report is an in-depth analysis detailing your home's value as well as a comparison with similar homes in the area
Purchase History
| Date | Buyer | Sale Price | Title Company |
|---|---|---|---|
| Cooley Justin R | -- | -- | |
| Hancock William A | -- | -- | |
| Davis Stacey E | -- | -- |
Source: Public Records
Mortgage History
| Date | Status | Borrower | Loan Amount |
|---|---|---|---|
| Open | Cooley Justin R | $131,081 | |
| Previous Owner | Hancock William A | $122,550 | |
| Previous Owner | Davis Stacey E | $105,976 |
Source: Public Records
Tax History
| Year | Tax Paid | Tax Assessment Tax Assessment Total Assessment is a certain percentage of the fair market value that is determined by local assessors to be the total taxable value of land and additions on the property. | Land | Improvement |
|---|---|---|---|---|
| 2025 | $1,730 | $11,532 | $0 | $0 |
| 2024 | $1,665 | $11,259 | $0 | $0 |
| 2023 | $1,665 | $11,259 | $0 | $0 |
| 2022 | $1,646 | $11,259 | $0 | $0 |
| 2021 | $1,656 | $11,259 | $0 | $0 |
| 2020 | $1,692 | $11,366 | $0 | $0 |
| 2019 | $1,701 | $11,366 | $0 | $0 |
| 2018 | $1,701 | $11,366 | $0 | $0 |
| 2017 | $1,655 | $11,366 | $0 | $0 |
| 2016 | $1,431 | $10,479 | $0 | $0 |
| 2015 | -- | $10,479 | $0 | $0 |
| 2014 | -- | $10,479 | $0 | $0 |
Source: Public Records
Map
Nearby Homes
- 23 Sunset Rd
- 908 Sunflower Dr
- 8 Twin Oaks Place
- 1616 W 3rd St
- 97 Wansley Rd
- 1500 W 1st St
- 104 N 14th Ave
- 951 Poplar Dr
- 1104 Wansley Rd
- 2 Larkmeade Ln
- 915 S 14th Ave
- 1 Larkmeade Ln
- 00 Bear Pen Creek Rd
- 0 Ellisville Blvd
- 1013 Wilson Ave
- 0 Wansley Rd
- 640 S Magnolia St
- 703 N 11th Ave
- 1222 W 5th St
- 1131 Capitol St
- 420 Pineview Dr Extension
- 424 Pineview Dr Extension
- 424 Pineview Dr
- 2710 Pecan Ridge Dr
- 7 Pine Lake Dr
- 425 Pineview Dr Extension
- 2718 Pecan Ridge Dr
- 423 Pineview Dr Extension
- 0 Pineview Lake
- 425 Pecan Ridge Drive Extension
- 415 Pecan Ridge Drive Extension
- 2622 Pecan Ridge Dr
- 425 Pecan Ridge Dr
- 2732 Pecan Ridge Dr
- 324 Pineview Dr
- 2727 Pecan Ridge Dr
- 426 Hillcrest Dr
- 2617 Pecan Ridge Dr
- 420 Hillcrest Dr
- 416 Pecan Ridge Drive Extension
Your Personal Tour Guide
Ask me questions while you tour the home.