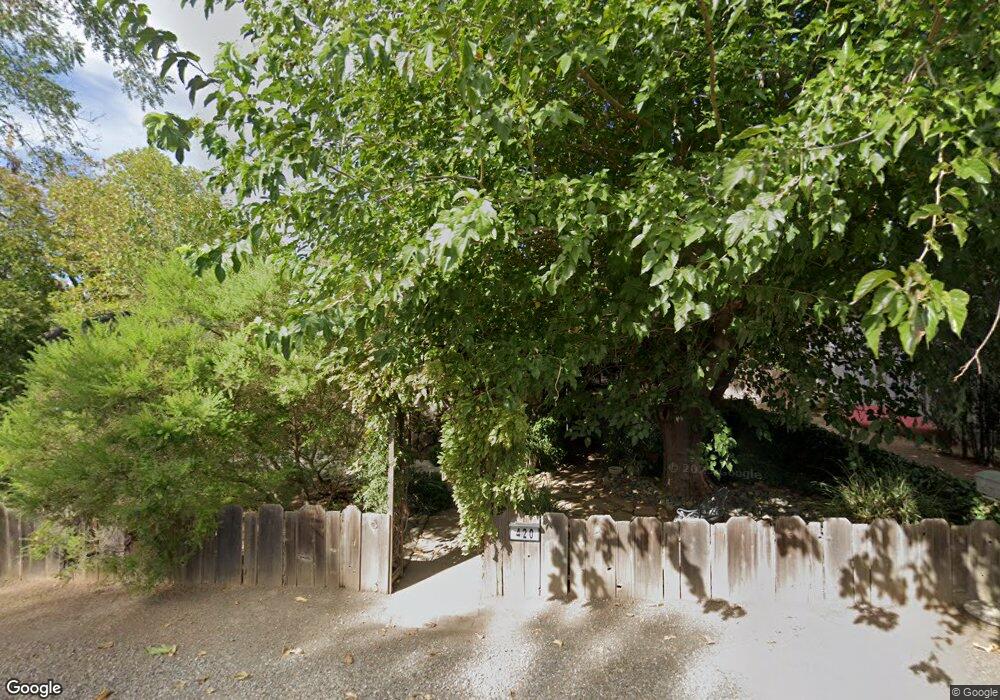
420 Ross Rd Red Bluff, CA 96080
Estimated Value: $157,000 - $278,000
2
Beds
1
Bath
994
Sq Ft
$240/Sq Ft
Est. Value
About This Home
This home is located at 420 Ross Rd, Red Bluff, CA 96080 and is currently estimated at $238,252, approximately $239 per square foot. 420 Ross Rd is a home located in Tehama County with nearby schools including Antelope Elementary School, Berrendos Middle School, and Red Bluff High School.
Ownership History
Date
Name
Owned For
Owner Type
Purchase Details
Closed on
Jan 31, 2018
Sold by
Young Susan L and Smith David C
Bought by
Young Susan L
Current Estimated Value
Purchase Details
Closed on
Feb 14, 2013
Sold by
Young Susan L
Bought by
Young Susan L and Smith David C
Purchase Details
Closed on
Sep 18, 2007
Sold by
Young Thomas D and Young Susan L
Bought by
Young Susan L and Young Thomas D
Home Financials for this Owner
Home Financials are based on the most recent Mortgage that was taken out on this home.
Original Mortgage
$10,500
Interest Rate
6.61%
Mortgage Type
Stand Alone Second
Create a Home Valuation Report for This Property
The Home Valuation Report is an in-depth analysis detailing your home's value as well as a comparison with similar homes in the area
Purchase History
| Date | Buyer | Sale Price | Title Company |
|---|---|---|---|
| Young Susan L | -- | None Available | |
| Young Susan L | -- | None Available | |
| Young Susan L | -- | Placer Title Company |
Source: Public Records
Mortgage History
| Date | Status | Borrower | Loan Amount |
|---|---|---|---|
| Closed | Young Susan L | $10,500 |
Source: Public Records
Tax History
| Year | Tax Paid | Tax Assessment Tax Assessment Total Assessment is a certain percentage of the fair market value that is determined by local assessors to be the total taxable value of land and additions on the property. | Land | Improvement |
|---|---|---|---|---|
| 2025 | $1,324 | $136,973 | $22,618 | $114,355 |
| 2023 | $1,305 | $131,656 | $21,741 | $109,915 |
| 2022 | $1,258 | $129,075 | $21,315 | $107,760 |
| 2021 | $1,235 | $126,546 | $20,898 | $105,648 |
| 2020 | $1,234 | $125,249 | $20,684 | $104,565 |
| 2019 | $1,228 | $122,794 | $20,279 | $102,515 |
| 2018 | $1,170 | $120,387 | $19,882 | $100,505 |
| 2017 | $1,179 | $118,028 | $19,493 | $98,535 |
| 2016 | $1,099 | $115,714 | $19,111 | $96,603 |
| 2015 | $1,081 | $113,976 | $18,824 | $95,152 |
| 2014 | $1,065 | $111,745 | $18,456 | $93,289 |
Source: Public Records
Map
Nearby Homes
- 100 Dale Ave
- 220 Gurnsey Dr
- 83 Damon Ave
- 321 Antelope Blvd
- 75 Sherman Dr
- 65 Mary Ln
- 5 Gurnsey Ave
- 105 Kimick Way
- 125 Kimick Way
- 566 Roundup Ave
- 508 Antoinette Ct
- 40 Sandy Way
- 55 Mina Ave
- 725 East Ave
- 710 Center Ave
- 350 Gilmore Rd
- 350 Gilmore Rd Unit Space 88
- 350 Gilmore Rd Unit 16
- 195 Howell Ave
- 275 Howell Ave
Your Personal Tour Guide
Ask me questions while you tour the home.