420 Ross Rd Red Bluff, CA 96080
Estimated Value: $169,000 - $263,000
About This Home
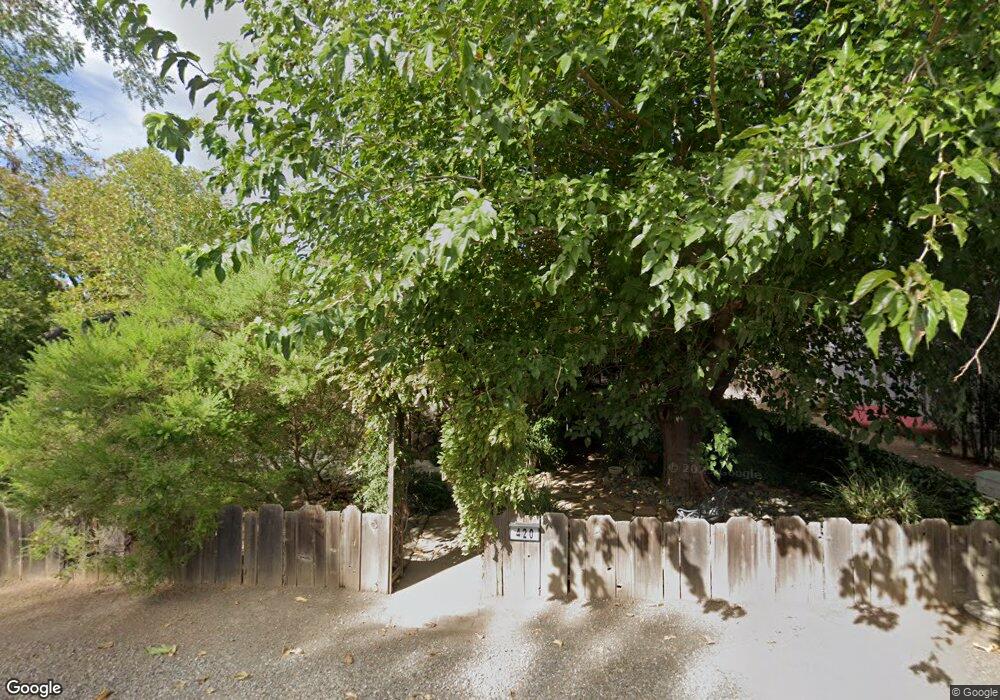
This home is located at 420 Ross Rd, Red Bluff, CA 96080 and is currently estimated at $230,445, approximately $231 per square foot. 420 Ross Rd is a home located in Tehama County with nearby schools including Antelope Elementary School, Berrendos Middle School, and Red Bluff High School.
Ownership History
We collect this data history from publicly available records. To have your information removed, we recommend requesting removal directly through your county’s website.
Purchase Details
Purchase Details
Purchase Details
Home Financials for this Owner
Home Financials are based on the most recent Mortgage that was taken out on this home.Purchase History
We collect this data history from publicly available records. To have your information removed, we recommend requesting removal directly through your county’s website.
| Date | Buyer | Sale Price | Title Company |
|---|---|---|---|
| -- | None Available | ||
| -- | None Available | ||
| -- | Placer Title Company |
Mortgage History
We collect this data history from publicly available records. To have your information removed, we recommend requesting removal directly through your county’s website.
| Date | Status | Borrower | Loan Amount |
|---|---|---|---|
| Closed | $10,500 |
Tax History
We collect this data history from publicly available records. To have your information removed, we recommend requesting removal directly through your county’s website.
| Year | Tax Paid | Tax Assessment Tax Assessment Total Assessment is a certain percentage of the fair market value that is determined by local assessors to be the total taxable value of land and additions on the property. | Land | Improvement |
|---|---|---|---|---|
| 2025 | $1,324 | $136,973 | $22,618 | $114,355 |
| 2023 | $1,305 | $131,656 | $21,741 | $109,915 |
| 2022 | $1,258 | $129,075 | $21,315 | $107,760 |
| 2021 | $1,235 | $126,546 | $20,898 | $105,648 |
| 2020 | $1,234 | $125,249 | $20,684 | $104,565 |
| 2019 | $1,228 | $122,794 | $20,279 | $102,515 |
| 2018 | $1,170 | $120,387 | $19,882 | $100,505 |
| 2017 | $1,179 | $118,028 | $19,493 | $98,535 |
| 2016 | $1,099 | $115,714 | $19,111 | $96,603 |
| 2015 | $1,081 | $113,976 | $18,824 | $95,152 |
| 2014 | $1,065 | $111,745 | $18,456 | $93,289 |
Map
- 475 Wiltsey Ave
- 505 Antelope Blvd
- 83 Damon Ave
- 55 Sherman Dr
- 5 Gurnsey Ave
- 165 Gurnsey Ave
- 126 Mary Ln
- 160 Kimick Way
- 150 Nina Ave
- 265 Kaer Ave
- 300 Chestnut Ave
- 515 Kaer Ave
- 130 Gilmore Rd
- 40 Sandy Way
- 55 Mina Ave
- 55 Mina Ave
- 725 East Ave
- 350 Gilmore Rd Unit Space 88
- 350 Gilmore Rd Unit 66
- 60 Lake Ave
Ask me questions while you tour the home.