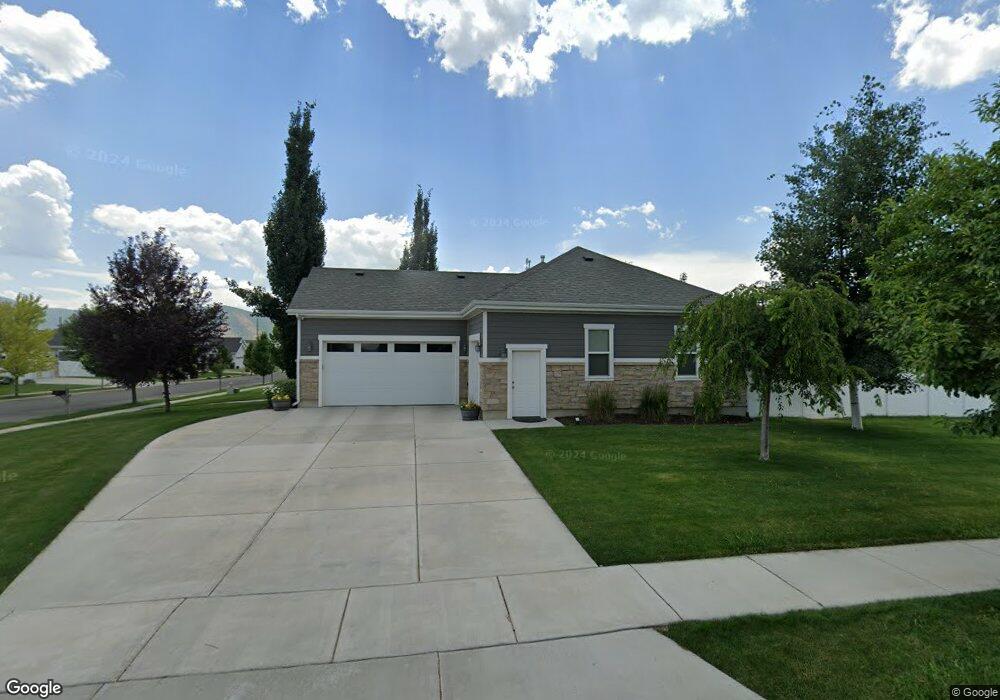
420 S 360 E Midway, UT 84049
Estimated Value: $866,000 - $1,085,000
Studio
--
Bath
1,701
Sq Ft
$603/Sq Ft
Est. Value
About This Home
This home is located at 420 S 360 E, Midway, UT 84049 and is currently estimated at $1,026,302, approximately $603 per square foot. 420 S 360 E is a home with nearby schools including Midway Elementary School, Rocky Mountain Middle School, and Wasatch High School.
Ownership History
Date
Name
Owned For
Owner Type
Purchase Details
Closed on
Mar 26, 2015
Sold by
Farmer Douglas A and Farmer Jennifer
Bought by
Farmer Douglas A and Farmer Jennifer R
Current Estimated Value
Home Financials for this Owner
Home Financials are based on the most recent Mortgage that was taken out on this home.
Original Mortgage
$350,000
Outstanding Balance
$267,768
Interest Rate
3.65%
Mortgage Type
New Conventional
Estimated Equity
$758,534
Purchase Details
Closed on
Dec 19, 2013
Sold by
Farmer Douglas A
Bought by
Farmer Douglas A and Farmer Jennifer
Home Financials for this Owner
Home Financials are based on the most recent Mortgage that was taken out on this home.
Original Mortgage
$351,500
Interest Rate
4.13%
Mortgage Type
New Conventional
Purchase Details
Closed on
Sep 8, 2011
Sold by
Utah Home Building Company
Bought by
Midway Land Holdings Llc
Create a Home Valuation Report for This Property
The Home Valuation Report is an in-depth analysis detailing your home's value as well as a comparison with similar homes in the area
Home Values in the Area
Average Home Value in this Area
Purchase History
| Date | Buyer | Sale Price | Title Company |
|---|---|---|---|
| Farmer Douglas A | -- | Pinnacle Title | |
| Farmer Douglas A | -- | First American Title Compa | |
| Farmer Douglas A | -- | Park City Title Company | |
| Midway Land Holdings Llc | -- | Park City Title Company |
Source: Public Records
Mortgage History
| Date | Status | Borrower | Loan Amount |
|---|---|---|---|
| Open | Farmer Douglas A | $350,000 | |
| Closed | Farmer Douglas A | $351,500 |
Source: Public Records
Tax History
| Year | Tax Paid | Tax Assessment Tax Assessment Total Assessment is a certain percentage of the fair market value that is determined by local assessors to be the total taxable value of land and additions on the property. | Land | Improvement |
|---|---|---|---|---|
| 2025 | $4,589 | $905,355 | $450,000 | $455,355 |
| 2024 | $4,649 | $927,575 | $450,000 | $477,575 |
| 2023 | $4,649 | $890,870 | $250,000 | $640,870 |
| 2022 | $4,913 | $890,870 | $250,000 | $640,870 |
| 2021 | $4,147 | $581,078 | $180,288 | $400,790 |
| 2020 | $4,276 | $581,078 | $180,288 | $400,790 |
| 2019 | $3,109 | $253,989 | $0 | $0 |
| 2018 | $3,109 | $253,989 | $0 | $0 |
| 2017 | $2,626 | $213,313 | $0 | $0 |
| 2016 | $2,415 | $191,313 | $0 | $0 |
| 2015 | $2,295 | $191,313 | $0 | $0 |
| 2014 | $599 | $221,038 | $0 | $0 |
Source: Public Records
Map
Nearby Homes
- 440 S 360 E
- 440 S 360 E Unit 52
- 390 S 360 E
- 390 S 360 E Unit 50
- 417 S 300 E
- 417 S 300 E Unit 7
- 417 S 300 E
- 460 S 360 E
- 460 S 360 E Unit 53
- 437 S 360 E
- 437 S 360 E Unit 39
- 395 S 360 E
- 395 S 360 E Unit 41
- 387 S 300 E
- 387 S 300 E Unit 6
- 461 S 360 E
- 461 S 360 E Unit 38
- 370 S 360 E Unit 49
- 370 S 360 E
- 435 S 300 E Unit 8
Your Personal Tour Guide
Ask me questions while you tour the home.