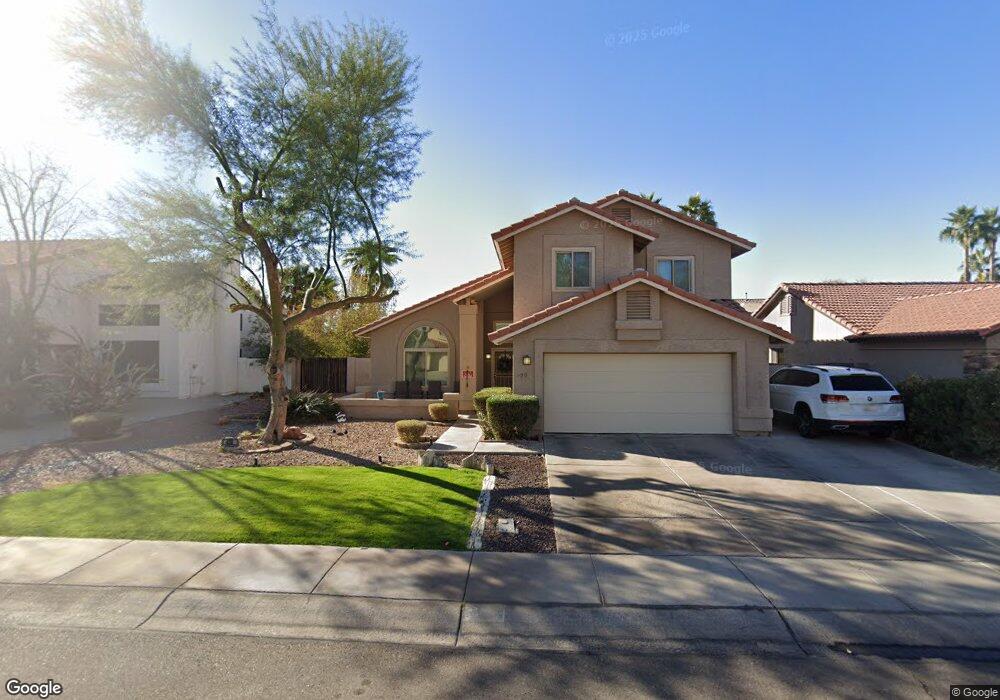
420 S Jay St Chandler, AZ 85225
Downtown Chandler NeighborhoodEstimated Value: $489,463 - $565,000
--
Bed
3
Baths
1,975
Sq Ft
$271/Sq Ft
Est. Value
About This Home
This home is located at 420 S Jay St, Chandler, AZ 85225 and is currently estimated at $534,866, approximately $270 per square foot. 420 S Jay St is a home located in Maricopa County with nearby schools including San Marcos Elementary School, Chandler High School, and Bogle Junior High School.
Ownership History
Date
Name
Owned For
Owner Type
Purchase Details
Closed on
Jul 20, 2000
Sold by
Jordan Elliott G and Jordan Tamera B
Bought by
Barlet Ii Michael S and Barlet Melissa A
Current Estimated Value
Home Financials for this Owner
Home Financials are based on the most recent Mortgage that was taken out on this home.
Original Mortgage
$130,150
Outstanding Balance
$46,473
Interest Rate
8.2%
Mortgage Type
New Conventional
Estimated Equity
$488,393
Purchase Details
Closed on
Apr 5, 1996
Sold by
Bogle Jackson Caine and Bogle Sybil Kathleen
Bought by
Jordan Elliott Gerard and Jordan Tamera B
Home Financials for this Owner
Home Financials are based on the most recent Mortgage that was taken out on this home.
Original Mortgage
$111,150
Interest Rate
7.84%
Mortgage Type
New Conventional
Create a Home Valuation Report for This Property
The Home Valuation Report is an in-depth analysis detailing your home's value as well as a comparison with similar homes in the area
Home Values in the Area
Average Home Value in this Area
Purchase History
| Date | Buyer | Sale Price | Title Company |
|---|---|---|---|
| Barlet Ii Michael S | $137,000 | Capital Title Agency | |
| Jordan Elliott Gerard | $114,000 | First American Title |
Source: Public Records
Mortgage History
| Date | Status | Borrower | Loan Amount |
|---|---|---|---|
| Open | Barlet Ii Michael S | $130,150 | |
| Previous Owner | Jordan Elliott Gerard | $111,150 |
Source: Public Records
Tax History Compared to Growth
Tax History
| Year | Tax Paid | Tax Assessment Tax Assessment Total Assessment is a certain percentage of the fair market value that is determined by local assessors to be the total taxable value of land and additions on the property. | Land | Improvement |
|---|---|---|---|---|
| 2025 | $2,066 | $22,098 | -- | -- |
| 2024 | $1,994 | $21,045 | -- | -- |
| 2023 | $1,994 | $37,320 | $7,460 | $29,860 |
| 2022 | $1,931 | $27,230 | $5,440 | $21,790 |
| 2021 | $1,985 | $25,600 | $5,120 | $20,480 |
| 2020 | $1,974 | $23,770 | $4,750 | $19,020 |
| 2019 | $1,905 | $22,370 | $4,470 | $17,900 |
| 2018 | $1,850 | $21,180 | $4,230 | $16,950 |
| 2017 | $1,739 | $20,360 | $4,070 | $16,290 |
| 2016 | $1,679 | $18,880 | $3,770 | $15,110 |
| 2015 | $1,610 | $17,880 | $3,570 | $14,310 |
Source: Public Records
Map
Nearby Homes
- 954 W Morelos St
- 850 S Vine St
- 726 S Nebraska St Unit 148
- 355 S Nebraska St
- 1152 W Cindy St
- 389 W Fairway Place
- 1162 S Cheri Lynn Dr
- 875 S Nebraska St Unit 37
- 875 S Nebraska St Unit 69
- 1201 S Tumbleweed Ln
- 1340 W Elgin St
- 733 W Flintlock Way
- 613 W Winchester Dr
- 807 W Toledo St
- 515 W Toledo St
- 1302 W Winchester Way
- 879 S Longmore St
- 121 N California St Unit 35
- 1393 W Winchester Way
- 1557 W Kesler Ln Unit 2
- 410 S Jay St
- 430 S Jay St
- 525 S Camellia Dr
- 545 S Camellia Dr
- 400 S Jay St
- 440 S Jay St
- 421 S Jay St
- 505 S Camellia Dr
- 565 S Camellia Dr
- 411 S Jay St
- 431 S Jay St
- 390 S Jay St Unit L@@K>>
- 390 S Jay St
- 450 S Jay St
- 485 S Camellia Dr
- 401 S Jay St
- 441 S Jay St
- 585 S Camellia Dr
- 391 S Jay St
- 465 S Camellia Dr