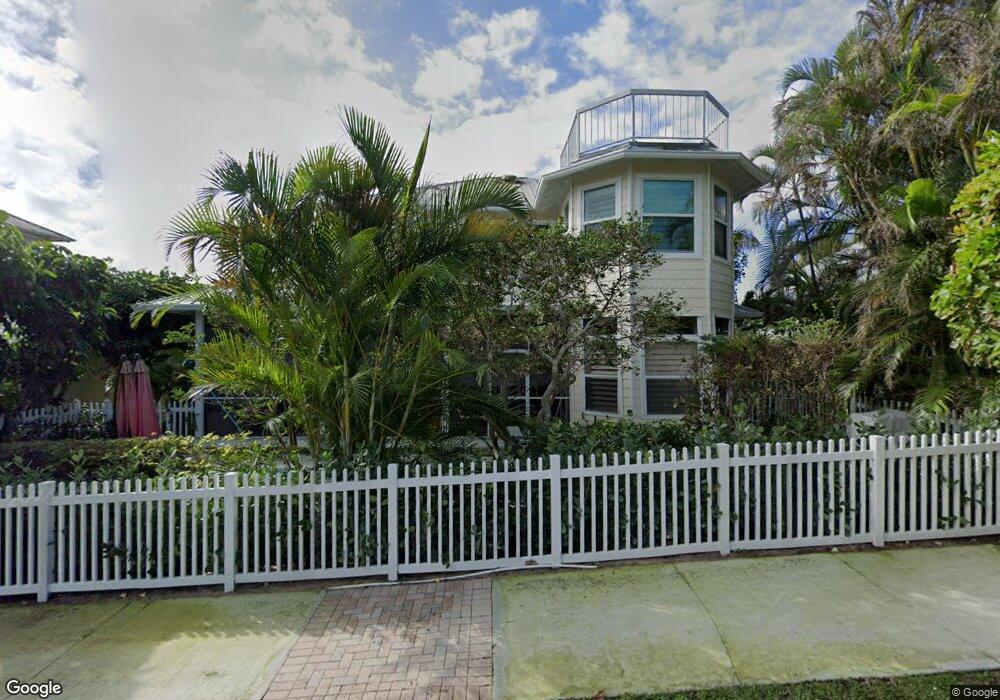
420 Seaside Ln Juno Beach, FL 33408
Estimated Value: $1,647,532 - $2,227,000
3
Beds
3
Baths
2,095
Sq Ft
$924/Sq Ft
Est. Value
About This Home
This home is located at 420 Seaside Ln, Juno Beach, FL 33408 and is currently estimated at $1,936,383, approximately $924 per square foot. 420 Seaside Ln is a home located in Palm Beach County with nearby schools including The Conservatory School at North Palm Beach, William T. Dwyer High School, and Howell L. Watkins Middle School.
Ownership History
Date
Name
Owned For
Owner Type
Purchase Details
Closed on
Sep 6, 2012
Sold by
Dicresce Amerigo J and Di Cresce Diane
Bought by
Koplovitz David and Koplovitz Carin
Current Estimated Value
Home Financials for this Owner
Home Financials are based on the most recent Mortgage that was taken out on this home.
Original Mortgage
$417,000
Outstanding Balance
$274,588
Interest Rate
2.87%
Mortgage Type
New Conventional
Estimated Equity
$1,661,795
Purchase Details
Closed on
Sep 14, 2007
Sold by
Dicresce Amerigo J and Di Cresce Diane
Bought by
Dicresce Diane and Di Cresce Amerigo J
Home Financials for this Owner
Home Financials are based on the most recent Mortgage that was taken out on this home.
Original Mortgage
$652,800
Interest Rate
6.41%
Mortgage Type
Reverse Mortgage Home Equity Conversion Mortgage
Purchase Details
Closed on
Apr 27, 1994
Sold by
Seaside Group
Bought by
Dicresce Amerigo J
Create a Home Valuation Report for This Property
The Home Valuation Report is an in-depth analysis detailing your home's value as well as a comparison with similar homes in the area
Home Values in the Area
Average Home Value in this Area
Purchase History
| Date | Buyer | Sale Price | Title Company |
|---|---|---|---|
| Koplovitz David | $595,000 | Attorney | |
| Dicresce Diane | -- | Action Title Company | |
| Dicresce Amerigo J | $130,000 | -- |
Source: Public Records
Mortgage History
| Date | Status | Borrower | Loan Amount |
|---|---|---|---|
| Open | Koplovitz David | $417,000 | |
| Previous Owner | Dicresce Diane | $652,800 |
Source: Public Records
Tax History
| Year | Tax Paid | Tax Assessment Tax Assessment Total Assessment is a certain percentage of the fair market value that is determined by local assessors to be the total taxable value of land and additions on the property. | Land | Improvement |
|---|---|---|---|---|
| 2025 | $18,531 | $983,283 | -- | -- |
| 2024 | $18,531 | $893,894 | -- | -- |
| 2023 | $17,723 | $812,631 | $0 | $0 |
| 2022 | $15,735 | $738,755 | $0 | $0 |
| 2021 | $14,045 | $771,498 | $371,953 | $399,545 |
| 2020 | $12,317 | $610,541 | $278,100 | $332,441 |
| 2019 | $12,538 | $614,824 | $278,100 | $336,724 |
| 2018 | $11,465 | $574,025 | $265,124 | $308,901 |
| 2017 | $11,372 | $560,104 | $252,499 | $307,605 |
| 2016 | $11,787 | $563,986 | $0 | $0 |
| 2015 | $11,686 | $538,022 | $0 | $0 |
| 2014 | $10,964 | $495,179 | $0 | $0 |
Source: Public Records
Map
Nearby Homes
- 400 Seaside Ln
- 410 Old Towne Ln
- 401 Olympus Dr
- 403 Olympus Dr
- 402 Ocean One Ln
- 20 Celestial Way Unit 215
- 1603 E Hemingway Dr
- 170 Celestial Way Unit 3-5
- 50 Celestial Way Unit 208
- 80 Celestial Way Unit 109
- 80 Celestial Way Unit 211
- 333 Ocean Dr
- 240 Celestial Way Unit 2
- 440 Jupiter Ln
- 290 Celestial Way Unit 20
- 270 Mercury Rd Unit D
- 471 N Juno Ln
- 420 Celestial Way Unit 1010
- 13440 Us Highway 1
- 440 Apollo Dr
- 430 Seaside Ln
- 410 Seaside Ln
- 0 Old Town Ln Unit R2979694
- 0 Old Town Ln Unit R3173401
- 6 Old Town Ln
- LOT 3 Old Town Ln
- 0 Old Town Ln Unit Lot 8
- 0 Old Town Ln Unit Lot 8
- 440 Seaside Ln
- 400 Seaside Ln Unit 1
- 430 Old Towne Ln
- 421 Seaside Ln
- 420 Old Towne Ln
- 440 Old Towne Ln
- 431 Seaside Ln
- 411 Seaside Ln
- 450 Seaside Ln
- 450 Old Towne Ln
- 441 Seaside Ln
- 401 Seaside Ln
Your Personal Tour Guide
Ask me questions while you tour the home.