Estimated Value: $598,000 - $703,000
3
Beds
1
Bath
792
Sq Ft
$842/Sq Ft
Est. Value
About This Home
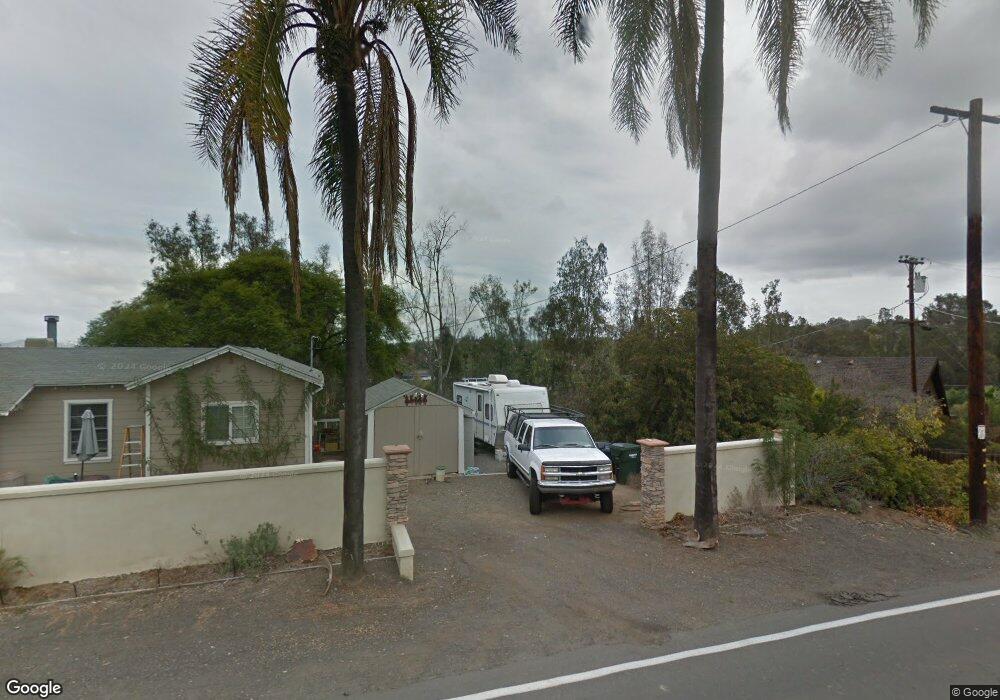
This home is located at 420 Taylor St, Vista, CA 92084 and is currently estimated at $666,768, approximately $841 per square foot. 420 Taylor St is a home located in San Diego County with nearby schools including Mission Meadows Elementary School, Roosevelt Middle School, and Vista High School.
Ownership History
Date
Name
Owned For
Owner Type
Purchase Details
Closed on
Jun 8, 2016
Sold by
Sliffe Brian P
Bought by
Sliffe Brian and Sliffe Amber
Current Estimated Value
Home Financials for this Owner
Home Financials are based on the most recent Mortgage that was taken out on this home.
Original Mortgage
$200,000
Outstanding Balance
$159,178
Interest Rate
3.57%
Mortgage Type
New Conventional
Estimated Equity
$507,590
Purchase Details
Closed on
Jul 7, 2009
Sold by
Sliffe Amber
Bought by
Sliffe Brian P
Home Financials for this Owner
Home Financials are based on the most recent Mortgage that was taken out on this home.
Original Mortgage
$176,000
Interest Rate
5.59%
Mortgage Type
New Conventional
Purchase Details
Closed on
Jan 26, 2001
Sold by
Burke Daniel V and Burke Susan B
Bought by
Sliffe Brian
Home Financials for this Owner
Home Financials are based on the most recent Mortgage that was taken out on this home.
Original Mortgage
$184,110
Interest Rate
7.11%
Mortgage Type
FHA
Purchase Details
Closed on
Oct 25, 1990
Create a Home Valuation Report for This Property
The Home Valuation Report is an in-depth analysis detailing your home's value as well as a comparison with similar homes in the area
Home Values in the Area
Average Home Value in this Area
Purchase History
| Date | Buyer | Sale Price | Title Company |
|---|---|---|---|
| Sliffe Brian | -- | Fidelity National Title Co | |
| Sliffe Brian P | -- | Stewart Title Company | |
| Sliffe Brian | $187,000 | South Coast Title Company | |
| -- | $136,000 | -- |
Source: Public Records
Mortgage History
| Date | Status | Borrower | Loan Amount |
|---|---|---|---|
| Open | Sliffe Brian | $200,000 | |
| Closed | Sliffe Brian P | $176,000 | |
| Previous Owner | Sliffe Brian | $184,110 |
Source: Public Records
Tax History Compared to Growth
Tax History
| Year | Tax Paid | Tax Assessment Tax Assessment Total Assessment is a certain percentage of the fair market value that is determined by local assessors to be the total taxable value of land and additions on the property. | Land | Improvement |
|---|---|---|---|---|
| 2025 | $2,959 | $281,756 | $212,906 | $68,850 |
| 2024 | $2,959 | $276,232 | $208,732 | $67,500 |
| 2023 | $2,886 | $270,817 | $204,640 | $66,177 |
| 2022 | $2,877 | $265,508 | $200,628 | $64,880 |
| 2021 | $2,812 | $260,303 | $196,695 | $63,608 |
| 2020 | $2,801 | $257,635 | $194,679 | $62,956 |
| 2019 | $2,759 | $252,584 | $190,862 | $61,722 |
| 2018 | $2,621 | $247,632 | $187,120 | $60,512 |
| 2017 | $2,571 | $242,777 | $183,451 | $59,326 |
| 2016 | $2,508 | $238,017 | $179,854 | $58,163 |
| 2015 | $2,497 | $234,443 | $177,153 | $57,290 |
| 2014 | $2,434 | $229,851 | $173,683 | $56,168 |
Source: Public Records
Map
Nearby Homes
- 1935 Cresthaven Dr
- 1957 Cresthaven Dr
- 2080 Curtis Dr
- 554 Taylor St
- 2090 Curtis Dr
- 2055 Riviera Dr
- 1649 San Luis Rey Ave
- 300 Paseo Marguerita
- 2033 Paseo de Anza
- 1998 Paseo Del Rey
- 1628 Manor Dr
- 1768 Henderson Ct
- 2060 E Vista Way
- 732 Osborne St
- 2326 Maelee Dr
- 378 Paseo Marguerita
- 1501 Anza Ave Unit 39
- 1501 Anza Ave Unit 3
- 1501 Anza Ave Unit 5
- 1501 Anza Ave Unit 72
- 0000 Taylor St
- 432 Taylor St
- 408 Taylor St
- 411 Taylor St
- 450 Taylor St
- 1845 Hayden Ranch Rd
- 1904 Cresthaven Dr
- 412 Taylor St
- 502 Taylor St
- 1912 Cresthaven Dr
- 410 Taylor St
- 1837 Hayden Ranch Rd
- 1 Taylor St
- 1801 Hayden Ranch Rd
- 551 Taylor St
- 542 Taylor St
- 1924 Cresthaven Dr
- 508 Taylor St
- 365 Taylor St
- 1831 Hayden Ranch Rd