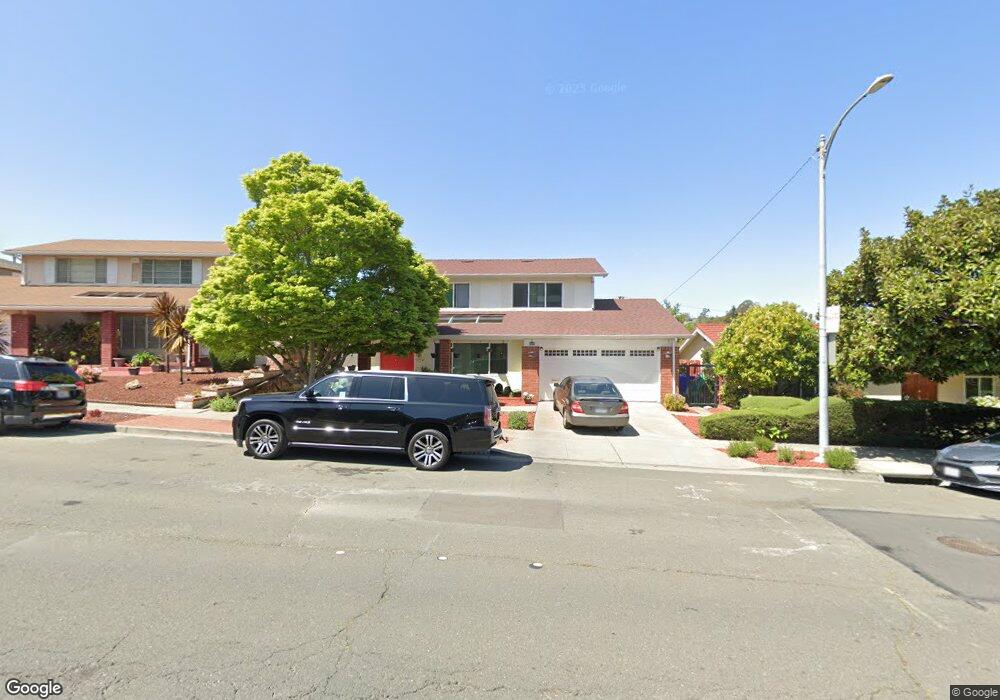
4200 Fran Way El Sobrante, CA 94803
May Valley NeighborhoodEstimated Value: $733,000 - $768,000
4
Beds
2
Baths
1,778
Sq Ft
$421/Sq Ft
Est. Value
About This Home
This home is located at 4200 Fran Way, El Sobrante, CA 94803 and is currently estimated at $748,877, approximately $421 per square foot. 4200 Fran Way is a home located in Contra Costa County with nearby schools including Murphy Elementary School, Betty Reid Soskin Middle School, and De Anza Senior High School.
Ownership History
Date
Name
Owned For
Owner Type
Purchase Details
Closed on
Jan 30, 2013
Sold by
The Bank Of New York Mellon
Bought by
Wong Fu Wan
Current Estimated Value
Purchase Details
Closed on
Nov 27, 2012
Sold by
Rance Marvelin and Rance Vickie Ann
Bought by
The Bank Of New York Mellon
Purchase Details
Closed on
Dec 2, 2009
Sold by
Rance Zackary A
Bought by
Rance Maruelin and Rance Vickie A
Purchase Details
Closed on
Feb 8, 2006
Sold by
Rance Marvelin and Rance Vickie Ann
Bought by
Rance Zackary Alexander
Home Financials for this Owner
Home Financials are based on the most recent Mortgage that was taken out on this home.
Original Mortgage
$503,200
Interest Rate
6%
Mortgage Type
Purchase Money Mortgage
Purchase Details
Closed on
Dec 14, 2005
Sold by
Wincentsen Carol Ann
Bought by
Rance Marvelin and Rance Vickie Ann
Home Financials for this Owner
Home Financials are based on the most recent Mortgage that was taken out on this home.
Original Mortgage
$503,200
Interest Rate
6%
Mortgage Type
Purchase Money Mortgage
Create a Home Valuation Report for This Property
The Home Valuation Report is an in-depth analysis detailing your home's value as well as a comparison with similar homes in the area
Home Values in the Area
Average Home Value in this Area
Purchase History
| Date | Buyer | Sale Price | Title Company |
|---|---|---|---|
| Wong Fu Wan | $281,000 | Chicago Title Company | |
| The Bank Of New York Mellon | $237,116 | Landsafe Title | |
| Rance Maruelin | -- | None Available | |
| Rance Zackary Alexander | -- | None Available | |
| Rance Marvelin | $629,000 | North American Title |
Source: Public Records
Mortgage History
| Date | Status | Borrower | Loan Amount |
|---|---|---|---|
| Previous Owner | Rance Marvelin | $503,200 |
Source: Public Records
Tax History Compared to Growth
Tax History
| Year | Tax Paid | Tax Assessment Tax Assessment Total Assessment is a certain percentage of the fair market value that is determined by local assessors to be the total taxable value of land and additions on the property. | Land | Improvement |
|---|---|---|---|---|
| 2025 | $6,028 | $346,018 | $227,808 | $118,210 |
| 2024 | $5,896 | $339,235 | $223,342 | $115,893 |
| 2023 | $5,896 | $332,584 | $218,963 | $113,621 |
| 2022 | $5,804 | $326,064 | $214,670 | $111,394 |
| 2021 | $5,762 | $319,671 | $210,461 | $109,210 |
| 2019 | $5,460 | $310,191 | $204,219 | $105,972 |
| 2018 | $5,253 | $304,110 | $200,215 | $103,895 |
| 2017 | $5,120 | $298,148 | $196,290 | $101,858 |
| 2016 | $5,040 | $292,303 | $192,442 | $99,861 |
| 2015 | $5,006 | $287,913 | $189,552 | $98,361 |
| 2014 | $4,956 | $282,274 | $185,839 | $96,435 |
Source: Public Records
Map
Nearby Homes
- 3115 Deseret Dr
- 371 Joan Vista St
- 4428 Santa Rita Rd
- 1923 Thompson Ln
- 4503 Gregory Way
- 663 Renfrew Rd
- 107 Alice Ln Unit 13
- 535 Rincon Rd
- 3179 Keith Dr
- 2835 Stephen Dr
- 636 Pebble Dr
- 4520 Valley View Rd
- 4623 Appian Way
- 5026 Hilltop Dr
- 4778 Hilltop Dr Unit 1
- 435 Colina Way
- 476 Colina Way
- 4404 Meadowbrook Dr
- 4556 Appian Way Unit 36
- 4556 Appian Way Unit 12
- 4212 Fran Way
- 4192 Fran Way
- 4220 Fran Way
- 4224 Fran Way
- 3100 Serene Ct
- 4191 Fran Way
- 4980 Appian Way
- 4221 Fran Way
- 4232 Fran Way
- 4990 Appian Way
- 4229 Fran Way
- 3107 Serene Ct
- 4159 Fran Way Unit 4143 Fran Way
- 4159 Fran Way
- 4159 Fran Way Unit 4159 Fran Way
- 3104 Serene Ct
- 4240 Fran Way
- 4233 Fran Way
- 5020 Appian Way
- 3111 Serene Ct