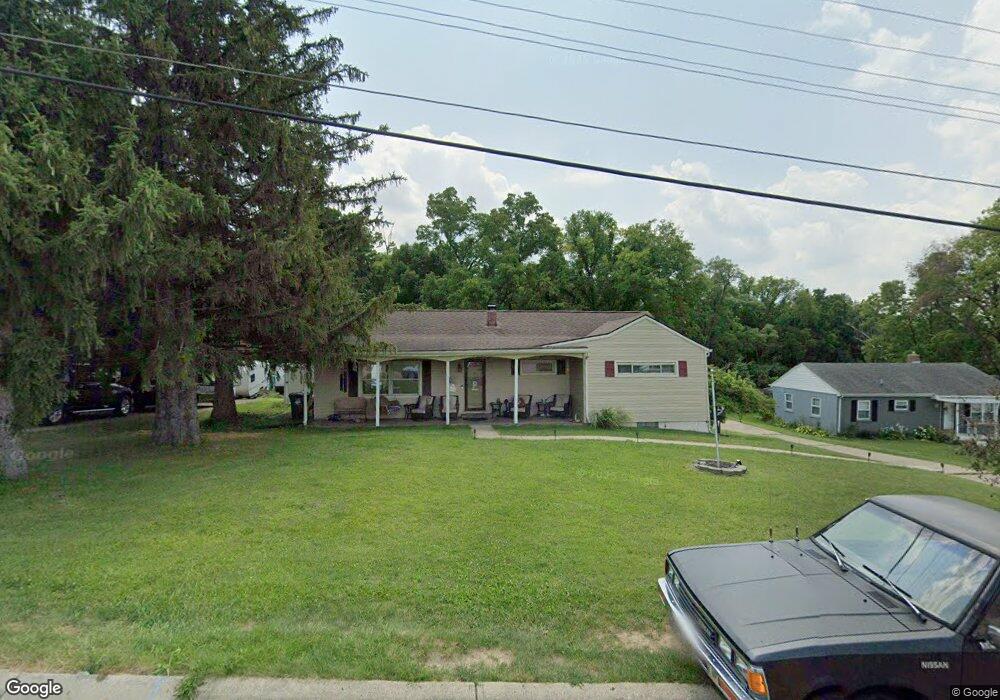
4200 Riverview Ave Middletown, OH 45042
Springhill NeighborhoodEstimated Value: $235,000 - $264,000
3
Beds
1
Bath
1,872
Sq Ft
$134/Sq Ft
Est. Value
About This Home
This home is located at 4200 Riverview Ave, Middletown, OH 45042 and is currently estimated at $250,517, approximately $133 per square foot. 4200 Riverview Ave is a home located in Butler County with nearby schools including Miller Ridge Elementary School, Highview 6th Grade Center, and Middletown Middle School.
Ownership History
Date
Name
Owned For
Owner Type
Purchase Details
Closed on
Nov 4, 2002
Sold by
Margerum Charles and Margerum Susan
Bought by
Powers Freddie L C and Powers Julie N
Current Estimated Value
Home Financials for this Owner
Home Financials are based on the most recent Mortgage that was taken out on this home.
Original Mortgage
$102,000
Outstanding Balance
$42,605
Interest Rate
6.37%
Mortgage Type
Purchase Money Mortgage
Estimated Equity
$207,912
Purchase Details
Closed on
Nov 7, 1997
Sold by
Smith Dennis R
Bought by
Margerum Charles and Margerum Susan
Home Financials for this Owner
Home Financials are based on the most recent Mortgage that was taken out on this home.
Original Mortgage
$98,580
Interest Rate
7.42%
Mortgage Type
New Conventional
Purchase Details
Closed on
Mar 1, 1991
Create a Home Valuation Report for This Property
The Home Valuation Report is an in-depth analysis detailing your home's value as well as a comparison with similar homes in the area
Home Values in the Area
Average Home Value in this Area
Purchase History
| Date | Buyer | Sale Price | Title Company |
|---|---|---|---|
| Powers Freddie L C | $127,500 | -- | |
| Margerum Charles | $106,500 | -- | |
| -- | $84,900 | -- |
Source: Public Records
Mortgage History
| Date | Status | Borrower | Loan Amount |
|---|---|---|---|
| Open | Powers Freddie L C | $102,000 | |
| Closed | Margerum Charles | $98,580 |
Source: Public Records
Tax History
| Year | Tax Paid | Tax Assessment Tax Assessment Total Assessment is a certain percentage of the fair market value that is determined by local assessors to be the total taxable value of land and additions on the property. | Land | Improvement |
|---|---|---|---|---|
| 2025 | $3,110 | $60,190 | $14,060 | $46,130 |
| 2024 | $3,110 | $60,190 | $14,060 | $46,130 |
| 2023 | $3,092 | $55,560 | $14,060 | $41,500 |
| 2022 | $2,666 | $45,850 | $14,060 | $31,790 |
| 2021 | $2,564 | $45,850 | $14,060 | $31,790 |
| 2020 | $2,671 | $45,850 | $14,060 | $31,790 |
| 2019 | $2,680 | $36,980 | $12,500 | $24,480 |
| 2018 | $2,334 | $36,980 | $12,500 | $24,480 |
| 2017 | $2,339 | $36,980 | $12,500 | $24,480 |
| 2016 | $2,368 | $35,860 | $12,500 | $23,360 |
| 2015 | $2,333 | $35,860 | $12,500 | $23,360 |
| 2014 | $2,031 | $35,860 | $12,500 | $23,360 |
| 2013 | $2,031 | $34,000 | $16,240 | $17,760 |
Source: Public Records
Map
Nearby Homes
- 4008 Lisa Ln
- 3910 Riverview Ave
- 4211 Vannest Ave
- 2204 Hawthorne St
- 3504 Jewell Ave
- 1600 Woodhall Ct
- 3419 Vannest Ave
- 4532 Miller Rd
- 4422 Riviera Dr
- 4524 Manchester Rd
- 3220 Illinois Ave
- 3218 Illinois Ave
- 1514 N Marshall Rd
- 5966 Warm Springs Dr
- 3214 Illinois Ave
- 4608 Manchester Rd
- 3200 Illinois Ave
- 3119 Tytus Ave
- 3113 Ohio Ave
- 3206 Bexley Dr
- 4112 Riverview Ave
- 4204 Riverview Ave
- 4201 Riverview Ave
- 4206 Riverview Ave
- 4203 Riverview Ave
- 4115 Riverview Ave
- 4208 Riverview Ave
- 4108 Riverview Ave
- 4205 Riverview Ave
- 4113 Riverview Ave
- 4207 Riverview Ave
- 4106 Riverview Ave
- 4111 Riverview Ave
- 4212 Riverview Ave
- 4104 Riverview Ave
- 4121 Lisa Ln
- 4107 Riverview Ave
- 2000 Spencer Ln
- 4102 Riverview Ave
- 4214 Riverview Ave
Your Personal Tour Guide
Ask me questions while you tour the home.