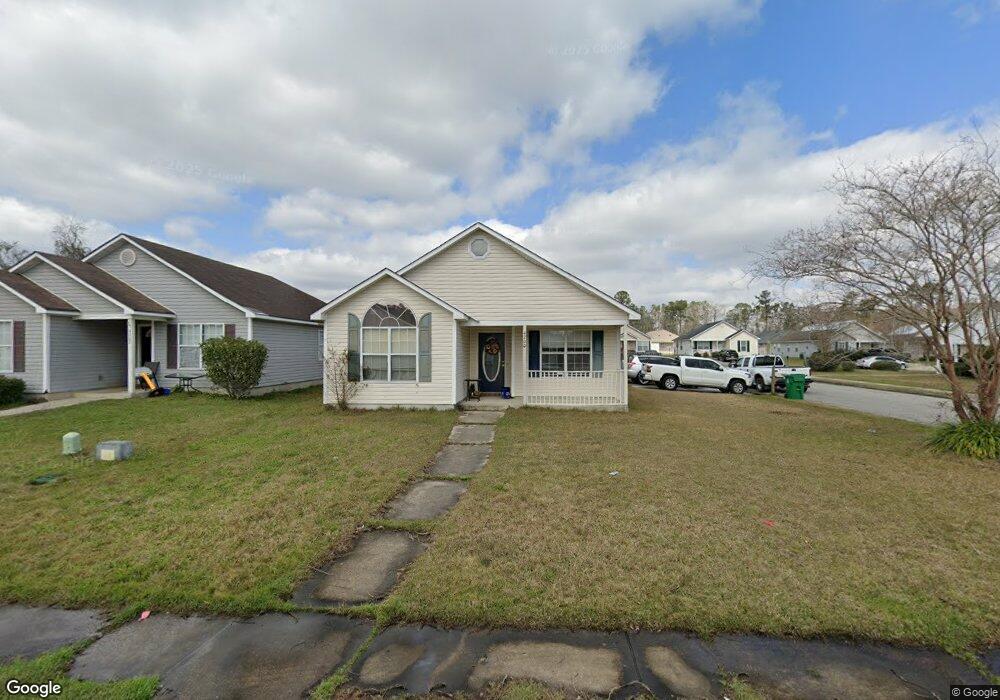
4200 Roxbury Dr Valdosta, GA 31605
Estimated Value: $154,815 - $197,000
3
Beds
2
Baths
1,337
Sq Ft
$128/Sq Ft
Est. Value
About This Home
This home is located at 4200 Roxbury Dr, Valdosta, GA 31605 and is currently estimated at $171,454, approximately $128 per square foot. 4200 Roxbury Dr is a home located in Lowndes County with nearby schools including Sallas Mahone Elementary School, Valdosta Middle School, and Valdosta High School.
Ownership History
Date
Name
Owned For
Owner Type
Purchase Details
Closed on
Mar 22, 2018
Sold by
Sec Of Veterans Affa
Bought by
Chen Chunlei Liu and Chen Li Mei
Current Estimated Value
Purchase Details
Closed on
Jan 5, 2018
Sold by
Carrington Mtg Svcs Llc
Bought by
Secretary Of Veterans Affairs and C/O Loan Guaranty Svcs
Purchase Details
Closed on
Dec 19, 2017
Sold by
Salazar Plata Juan G
Bought by
Carrington Mtg Svcs Llc
Purchase Details
Closed on
Feb 8, 2008
Sold by
Davila Carlos A
Bought by
Salazar Plata Juan G
Home Financials for this Owner
Home Financials are based on the most recent Mortgage that was taken out on this home.
Original Mortgage
$108,279
Interest Rate
5.85%
Mortgage Type
New Conventional
Purchase Details
Closed on
Mar 24, 2000
Sold by
Orenstein Mark
Bought by
Davila Carlos A and Davila Ruth
Purchase Details
Closed on
Sep 11, 1998
Bought by
Orenstein Mark
Purchase Details
Closed on
Oct 8, 1996
Bought by
Stoker Group Inc The
Create a Home Valuation Report for This Property
The Home Valuation Report is an in-depth analysis detailing your home's value as well as a comparison with similar homes in the area
Home Values in the Area
Average Home Value in this Area
Purchase History
| Date | Buyer | Sale Price | Title Company |
|---|---|---|---|
| Chen Chunlei Liu | -- | -- | |
| Secretary Of Veterans Affairs | -- | -- | |
| Carrington Mtg Svcs Llc | $108,279 | -- | |
| Salazar Plata Juan G | $106,000 | -- | |
| Davila Carlos A | $72,900 | -- | |
| Orenstein Mark | $12,500 | -- | |
| Stoker Group Inc The | -- | -- |
Source: Public Records
Mortgage History
| Date | Status | Borrower | Loan Amount |
|---|---|---|---|
| Previous Owner | Salazar Plata Juan G | $108,279 |
Source: Public Records
Tax History Compared to Growth
Tax History
| Year | Tax Paid | Tax Assessment Tax Assessment Total Assessment is a certain percentage of the fair market value that is determined by local assessors to be the total taxable value of land and additions on the property. | Land | Improvement |
|---|---|---|---|---|
| 2024 | $1,120 | $40,106 | $8,800 | $31,306 |
| 2023 | $1,120 | $40,106 | $8,800 | $31,306 |
| 2022 | $1,152 | $40,106 | $8,800 | $31,306 |
| 2021 | $969 | $27,860 | $5,000 | $22,860 |
| 2020 | $989 | $27,860 | $5,000 | $22,860 |
| 2019 | $1,007 | $28,368 | $5,000 | $23,368 |
| 2018 | $1,020 | $28,368 | $5,000 | $23,368 |
| 2017 | $1,027 | $28,368 | $5,000 | $23,368 |
| 2016 | $1,026 | $28,368 | $5,000 | $23,368 |
| 2015 | $941 | $28,368 | $5,000 | $23,368 |
| 2014 | $1,160 | $34,384 | $10,000 | $24,384 |
Source: Public Records
Map
Nearby Homes
- 4064 Chadwyck Dr
- 4305 Brandonshire Ln
- 4085 Chadwyck Dr
- 4203 Wilshire Dr
- 3676 Tupelo Rd
- 3703 Deidra Miller Cir
- 3202 Tyndall Dr Unit A/B
- 2943 Findley Chase
- 3200 Tyndall Dr Unit A/B
- 3122 Tyndall Dr
- 3120 Tyndall Dr
- 3903 Pecan Dr
- 3222 Fred Walker Rd
- 3932 Mount Zion Church Rd
- 3917 Pecan Dr
- 4004 Tack Trail
- TBD Jaycee Shack Rd
- 7.63 AC Tyndall Dr
- 2019 Fallingleaf Ln
- TBD Mable Rd
- 4202 Roxbury Dr
- 4204 Roxbury Dr
- 4044 Chadwyck Dr
- 4206 Roxbury Dr
- 4047 Chadwyck Dr
- 4049 Chadwyck Dr
- 4045 Chadwyck Dr
- 4201 Roxbury Dr
- 4203 Roxbury Dr
- 4208 Roxbury Dr
- 4048 Chadwyck Dr
- 4041 Chadwyck Dr
- 4205 Roxbury Dr
- 4052 Chadwyck Dr
- 4054 Chadwyck Dr
- 4050 Chadwyck Dr
- 4207 Roxbury Dr
- 4210 Roxbury Dr
- 4039 Chadwyck Dr