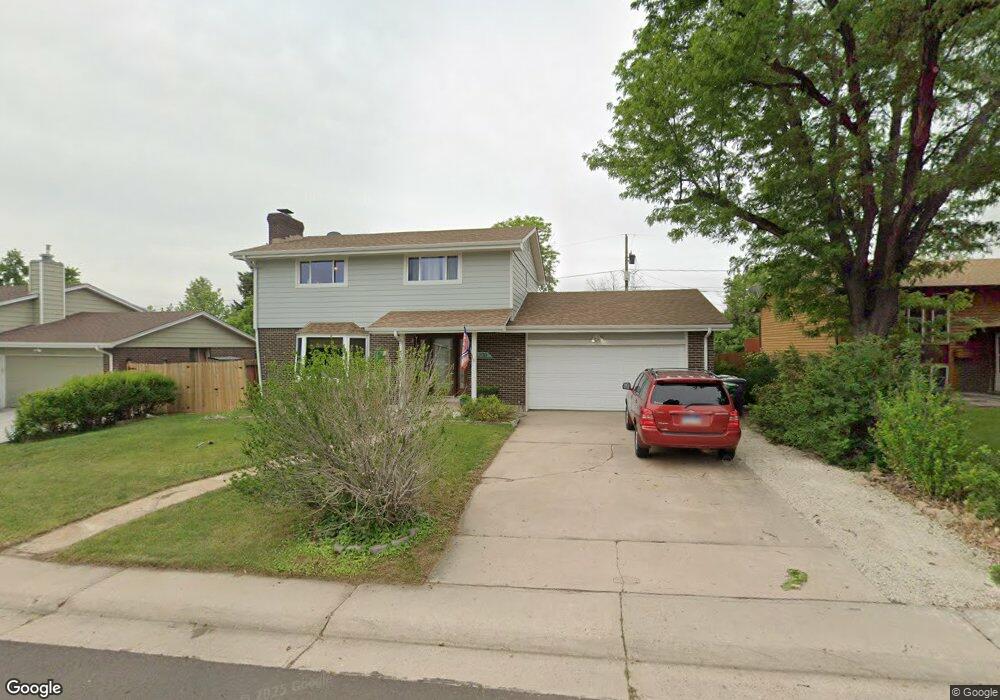
4200 W Rutgers Place Denver, CO 80236
Fort Logan NeighborhoodEstimated Value: $647,000 - $701,000
4
Beds
4
Baths
2,292
Sq Ft
$290/Sq Ft
Est. Value
About This Home
This home is located at 4200 W Rutgers Place, Denver, CO 80236 and is currently estimated at $665,341, approximately $290 per square foot. 4200 W Rutgers Place is a home located in Denver County with nearby schools including Kaiser Elementary School, Bear Valley International School, and John F Kennedy High School.
Ownership History
Date
Name
Owned For
Owner Type
Purchase Details
Closed on
Feb 5, 1999
Sold by
Lautenschlager John M and Savarese Rosemarie J
Bought by
Lautenschlager John M and Lautenschlager Rosemarie J
Current Estimated Value
Home Financials for this Owner
Home Financials are based on the most recent Mortgage that was taken out on this home.
Original Mortgage
$137,500
Interest Rate
6.78%
Purchase Details
Closed on
Apr 11, 1997
Sold by
Anthony Guzman and Anthony Yvonne B
Bought by
Lautenschlager John M and Savarese Rosemarie J
Home Financials for this Owner
Home Financials are based on the most recent Mortgage that was taken out on this home.
Original Mortgage
$114,000
Interest Rate
7.82%
Purchase Details
Closed on
Nov 24, 1993
Sold by
Mckeever Patricia J
Bought by
Guzman Anthony and Guzman Yvonne B
Home Financials for this Owner
Home Financials are based on the most recent Mortgage that was taken out on this home.
Original Mortgage
$120,550
Interest Rate
6.86%
Create a Home Valuation Report for This Property
The Home Valuation Report is an in-depth analysis detailing your home's value as well as a comparison with similar homes in the area
Home Values in the Area
Average Home Value in this Area
Purchase History
| Date | Buyer | Sale Price | Title Company |
|---|---|---|---|
| Lautenschlager John M | -- | Chicago Title | |
| Lautenschlager John M | $146,000 | Stewart Title | |
| Guzman Anthony | $126,900 | -- |
Source: Public Records
Mortgage History
| Date | Status | Borrower | Loan Amount |
|---|---|---|---|
| Closed | Lautenschlager John M | $137,500 | |
| Closed | Lautenschlager John M | $114,000 | |
| Previous Owner | Guzman Anthony | $120,550 |
Source: Public Records
Tax History Compared to Growth
Tax History
| Year | Tax Paid | Tax Assessment Tax Assessment Total Assessment is a certain percentage of the fair market value that is determined by local assessors to be the total taxable value of land and additions on the property. | Land | Improvement |
|---|---|---|---|---|
| 2024 | $3,271 | $41,300 | $1,870 | $39,430 |
| 2023 | $3,200 | $41,300 | $1,870 | $39,430 |
| 2022 | $2,197 | $27,620 | $5,760 | $21,860 |
| 2021 | $2,121 | $28,420 | $5,930 | $22,490 |
| 2020 | $2,006 | $27,040 | $5,390 | $21,650 |
| 2019 | $1,950 | $27,040 | $5,390 | $21,650 |
| 2018 | $1,727 | $22,320 | $4,890 | $17,430 |
| 2017 | $1,722 | $22,320 | $4,890 | $17,430 |
| 2016 | $1,502 | $18,420 | $5,405 | $13,015 |
| 2015 | $1,439 | $18,420 | $5,405 | $13,015 |
| 2014 | $1,247 | $15,020 | $3,980 | $11,040 |
Source: Public Records
Map
Nearby Homes
- 4155 W Stanford Ave
- 4415 S Tennyson St
- 4201 W Tufts Ave
- 4474 S Vrain St
- 4095 W Radcliff Ave
- 4665 S Raleigh St
- 4621 S Perry Way
- 3963 W Temple Place
- 4720 W Stanford Ave
- 4645 W Temple Place
- 3831 W Rutgers Place
- 3713 W Union Ave
- 4090 W Wagon Trail Dr
- 4640 W Princeton Ave
- 4445 S Lowell Blvd
- 3616 W Radcliff Ave Unit D9
- 3742 W Union Ave
- 4643 S Lowell Blvd Unit B
- 3659 W Union Ave Unit F4
- 4621 S Lowell Blvd Unit J6
- 4240 W Rutgers Place
- 4160 W Rutgers Place
- 4280 W Rutgers Place
- 4235 W Rutgers Place
- 4100 W Rutgers Place
- 4201 W Rice Place
- 4205 W Rutgers Place
- 4265 W Rutgers Place
- 4101 W Rice Place
- 4261 W Rice Place
- 4155 W Rutgers Place
- 4300 W Rutgers Place
- 4305 W Rutgers Place
- 4301 W Rice Place
- 4105 W Rutgers Place
- 4152 W Rice Place
- 4204 W Radcliff Ave
- 4234 W Radcliff Ave
- 4345 W Rutgers Place
- 4350 W Rutgers Place