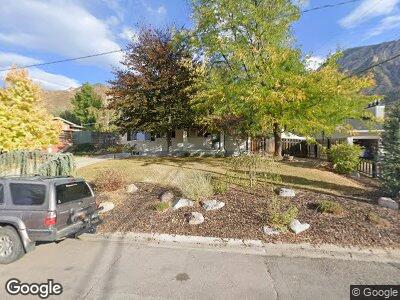
4201 Mars Way Salt Lake City, UT 84124
Mount Olympus NeighborhoodEstimated Value: $836,000 - $904,000
4
Beds
2
Baths
2,388
Sq Ft
$368/Sq Ft
Est. Value
About This Home
This home is located at 4201 Mars Way, Salt Lake City, UT 84124 and is currently estimated at $878,036, approximately $367 per square foot. 4201 Mars Way is a home located in Salt Lake County with nearby schools including Oakridge Elementary School, Churchill Junior High School, and Skyline High School.
Ownership History
Date
Name
Owned For
Owner Type
Purchase Details
Closed on
Feb 12, 2024
Sold by
Legorburu Gabriel and Legorburu Hannah
Bought by
Kofler Franz
Current Estimated Value
Home Financials for this Owner
Home Financials are based on the most recent Mortgage that was taken out on this home.
Original Mortgage
$437,000
Outstanding Balance
$432,627
Interest Rate
6.61%
Mortgage Type
New Conventional
Estimated Equity
$404,024
Purchase Details
Closed on
May 26, 2022
Sold by
Isaac Wu
Bought by
Legorburu Gabriel and Legorburu Hannah
Home Financials for this Owner
Home Financials are based on the most recent Mortgage that was taken out on this home.
Original Mortgage
$209,100
Interest Rate
5.1%
Mortgage Type
New Conventional
Purchase Details
Closed on
Mar 10, 2015
Sold by
Wu Isaac
Bought by
Wu Isaac
Home Financials for this Owner
Home Financials are based on the most recent Mortgage that was taken out on this home.
Original Mortgage
$325,000
Interest Rate
3.54%
Mortgage Type
New Conventional
Purchase Details
Closed on
Apr 17, 2014
Sold by
Thompson Bess P and Thompson Robert B
Bought by
Wu Isaac
Home Financials for this Owner
Home Financials are based on the most recent Mortgage that was taken out on this home.
Original Mortgage
$337,500
Interest Rate
4.23%
Mortgage Type
New Conventional
Purchase Details
Closed on
Mar 2, 2011
Sold by
Thompson Robert B and Thompson Bess P
Bought by
Thompson Bess P and Thompson Robert B
Home Financials for this Owner
Home Financials are based on the most recent Mortgage that was taken out on this home.
Original Mortgage
$203,500
Interest Rate
4.75%
Mortgage Type
New Conventional
Purchase Details
Closed on
Mar 3, 2004
Sold by
Fannie Mae
Bought by
Thompson Robert B and Thompson Bess P
Home Financials for this Owner
Home Financials are based on the most recent Mortgage that was taken out on this home.
Original Mortgage
$165,200
Interest Rate
5.61%
Mortgage Type
Purchase Money Mortgage
Purchase Details
Closed on
Jun 12, 2003
Sold by
Cornaby Gordon M and Cornaby Maryellea M
Bought by
Greaves Brent M and Greaves Lisa Kay
Purchase Details
Closed on
Apr 4, 1998
Sold by
Clinton Mark J and Clinton Jana L
Bought by
Cornaby Gordon M and Cornaby Maryellea M
Purchase Details
Closed on
Nov 4, 1993
Sold by
Western Management Services Inc
Bought by
Clinton Mark J and Clinton Jana L
Home Financials for this Owner
Home Financials are based on the most recent Mortgage that was taken out on this home.
Original Mortgage
$145,200
Interest Rate
6.97%
Create a Home Valuation Report for This Property
The Home Valuation Report is an in-depth analysis detailing your home's value as well as a comparison with similar homes in the area
Home Values in the Area
Average Home Value in this Area
Purchase History
| Date | Buyer | Sale Price | Title Company |
|---|---|---|---|
| Kofler Franz | -- | Metro National Title | |
| Legorburu Gabriel | -- | Cottonwood Title | |
| Wu Isaac | -- | None Available | |
| Wu Isaac | -- | Keystone Title Ins Agcy Llc | |
| Thompson Bess P | -- | Titan Title Ins Agcy Inc | |
| Thompson Robert B | $206,500 | United Title Services | |
| Greaves Brent M | -- | Superior Title | |
| Cornaby Gordon M | -- | -- | |
| Clinton Mark J | -- | -- |
Source: Public Records
Mortgage History
| Date | Status | Borrower | Loan Amount |
|---|---|---|---|
| Open | Kofler Franz | $437,000 | |
| Previous Owner | Legorburu Gabriel | $209,100 | |
| Previous Owner | Wu Issac | $317,200 | |
| Previous Owner | Wu Isaac | $325,000 | |
| Previous Owner | Wu Isaac | $337,500 | |
| Previous Owner | Thompson Bess P | $163,451 | |
| Previous Owner | Thompson Bess P | $203,500 | |
| Previous Owner | Thompson Robert B | $149,000 | |
| Previous Owner | Thompson Robert B | $75,000 | |
| Previous Owner | Thompson Robert B | $165,200 | |
| Previous Owner | Clinton Mark J | $145,200 |
Source: Public Records
Tax History Compared to Growth
Tax History
| Year | Tax Paid | Tax Assessment Tax Assessment Total Assessment is a certain percentage of the fair market value that is determined by local assessors to be the total taxable value of land and additions on the property. | Land | Improvement |
|---|---|---|---|---|
| 2023 | $5,302 | $819,500 | $204,800 | $614,700 |
| 2022 | $3,941 | $612,300 | $200,800 | $411,500 |
| 2021 | $3,597 | $484,500 | $163,500 | $321,000 |
| 2020 | $3,569 | $453,700 | $137,600 | $316,100 |
| 2019 | $3,503 | $435,100 | $129,800 | $305,300 |
| 2018 | $311 | $412,700 | $129,800 | $282,900 |
| 2017 | $3,140 | $393,500 | $129,800 | $263,700 |
| 2016 | $3,084 | $390,100 | $129,800 | $260,300 |
| 2015 | $2,886 | $341,700 | $164,700 | $177,000 |
| 2014 | $2,662 | $308,300 | $158,300 | $150,000 |
Source: Public Records
Map
Nearby Homes
- 3794 E Hermes Dr
- 4131 S Fortuna Way
- 3756 E Hermes Dr
- 3794 Hermes Dr
- 44 E Apollo Dr
- 3640 Aurora Cir S
- 3630 Aurora Cir S
- 3501 E Loren von Dr
- 3610 E Aurora Cir
- 4196 S 3320 E
- 3885 E Viewcrest Cir
- 3391 Brockbank Dr
- 3391 E Brockbank Dr
- 4455 S Loren von Dr
- 3427 E Brockbank Dr
- 4279 S Lares Cir
- 3655 E Oak Rim Way
- 4011 Mount Olympus Way
- 3850 S Quail Hollow Dr Unit 22
- 3376 E 3900 S
- 4201 Mars Way
- 4201 S Mars Way
- 4206 S Fortuna Way
- 3628 Ceres Dr
- 4211 Mars Way
- 4211 S Mars Way
- 4206 Fortuna Way
- 4196 S Fortuna Way
- 4210 Fortuna Way
- 4196 Fortuna Way
- 4220 S Fortuna Way
- 4219 Mars Way
- 4192 Mars Way
- 4200 Mars Way
- 4220 Fortuna Way
- 4208 Mars Way
- 4192 S Mars Way
- 4230 S Fortuna Way
- 4216 Mars Way
- 4208 S Mars Way