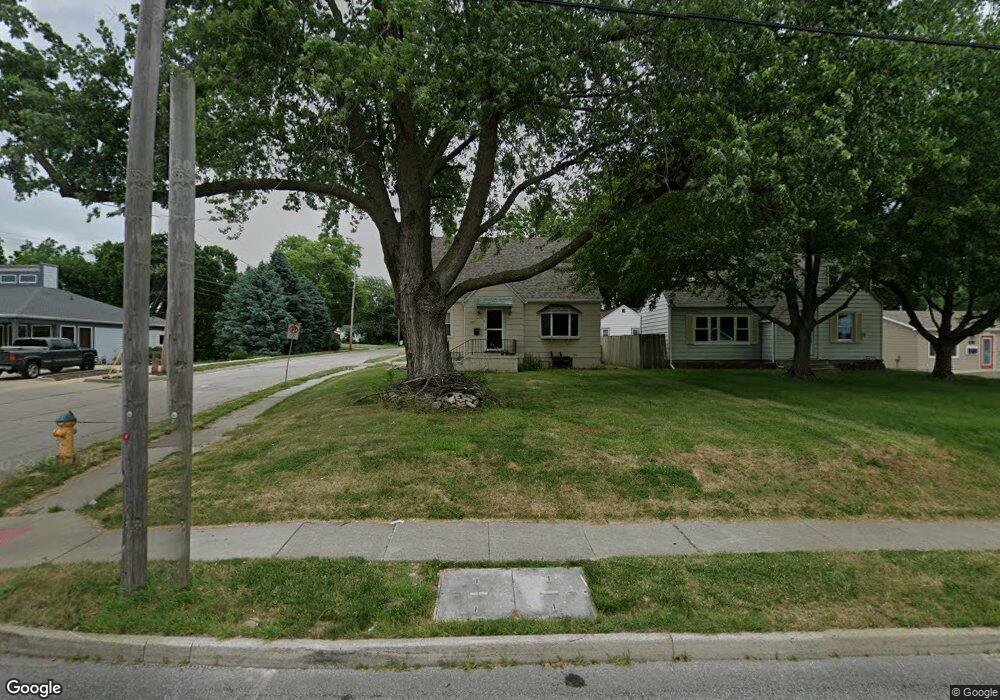
4201 SW 9th St Des Moines, IA 50315
Watrous Heights NeighborhoodEstimated Value: $145,398 - $200,000
4
Beds
2
Baths
1,162
Sq Ft
$152/Sq Ft
Est. Value
About This Home
This home is located at 4201 SW 9th St, Des Moines, IA 50315 and is currently estimated at $177,100, approximately $152 per square foot. 4201 SW 9th St is a home located in Polk County with nearby schools including South Union Elementary School, Brody Middle School, and Lincoln High School.
Ownership History
Date
Name
Owned For
Owner Type
Purchase Details
Closed on
Jan 5, 2018
Sold by
Risvold Mark D and Risvold Kristina D
Bought by
Housebuyers Llc
Current Estimated Value
Purchase Details
Closed on
May 15, 1999
Sold by
Scrivner Jeffrey D and Scrivner Theresa A
Bought by
Risvold Mark D and Risvold Kristina D
Home Financials for this Owner
Home Financials are based on the most recent Mortgage that was taken out on this home.
Original Mortgage
$58,400
Interest Rate
6.92%
Create a Home Valuation Report for This Property
The Home Valuation Report is an in-depth analysis detailing your home's value as well as a comparison with similar homes in the area
Home Values in the Area
Average Home Value in this Area
Purchase History
| Date | Buyer | Sale Price | Title Company |
|---|---|---|---|
| Housebuyers Llc | $85,000 | None Available | |
| Risvold Mark D | $72,500 | -- |
Source: Public Records
Mortgage History
| Date | Status | Borrower | Loan Amount |
|---|---|---|---|
| Previous Owner | Risvold Mark D | $58,400 |
Source: Public Records
Tax History Compared to Growth
Tax History
| Year | Tax Paid | Tax Assessment Tax Assessment Total Assessment is a certain percentage of the fair market value that is determined by local assessors to be the total taxable value of land and additions on the property. | Land | Improvement |
|---|---|---|---|---|
| 2025 | $2,222 | $127,100 | $28,200 | $98,900 |
| 2024 | $2,222 | $113,000 | $24,600 | $88,400 |
| 2023 | $2,124 | $113,000 | $24,600 | $88,400 |
| 2022 | $2,108 | $90,100 | $20,200 | $69,900 |
| 2021 | $2,124 | $90,100 | $20,200 | $69,900 |
| 2020 | $2,206 | $85,100 | $18,900 | $66,200 |
| 2019 | $2,364 | $85,100 | $18,900 | $66,200 |
| 2018 | $2,110 | $88,000 | $16,500 | $71,500 |
| 2017 | $2,018 | $88,000 | $16,500 | $71,500 |
| 2016 | $1,960 | $83,100 | $15,300 | $67,800 |
| 2015 | $1,960 | $83,100 | $15,300 | $67,800 |
| 2014 | $1,940 | $84,700 | $15,200 | $69,500 |
Source: Public Records
Map
Nearby Homes