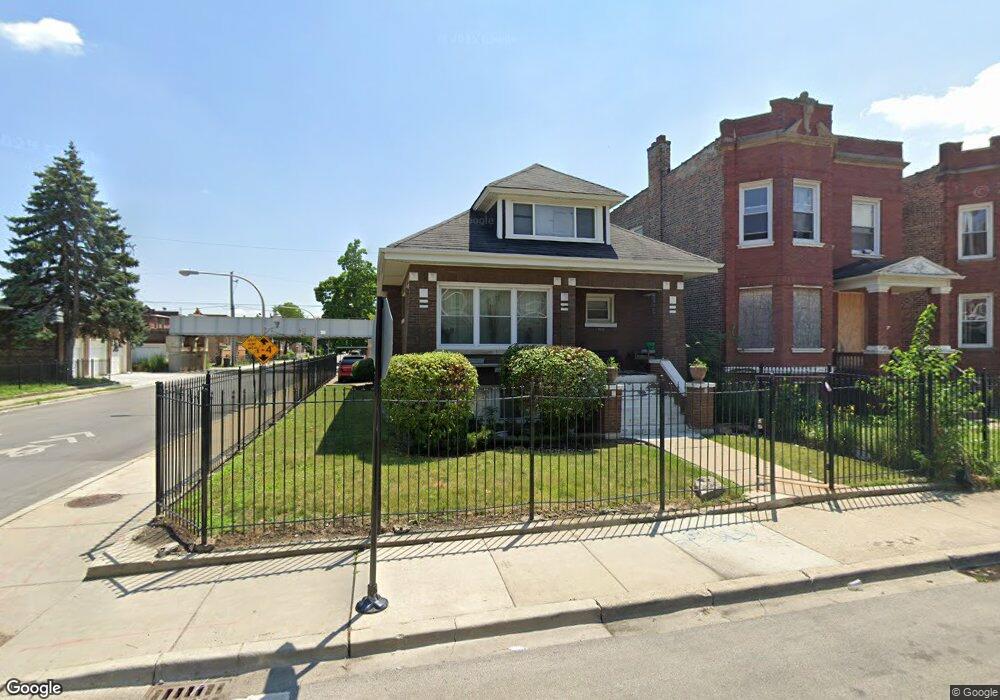
4201 W Cullerton St Chicago, IL 60623
North Lawndale NeighborhoodEstimated Value: $224,089 - $297,000
4
Beds
3
Baths
1,286
Sq Ft
$206/Sq Ft
Est. Value
About This Home
This home is located at 4201 W Cullerton St, Chicago, IL 60623 and is currently estimated at $265,022, approximately $206 per square foot. 4201 W Cullerton St is a home located in Cook County with nearby schools including Mason Elementary School, KIPP Chicago Chrtrs - Ascend Acad, and Epiphany Catholic School.
Ownership History
Date
Name
Owned For
Owner Type
Purchase Details
Closed on
Feb 8, 2001
Sold by
Vilaythong Myle
Bought by
Redditt Bertram and Redditt Geraldine
Current Estimated Value
Home Financials for this Owner
Home Financials are based on the most recent Mortgage that was taken out on this home.
Original Mortgage
$108,000
Interest Rate
7.25%
Purchase Details
Closed on
Dec 15, 2000
Sold by
R M Financial Profiles Inc
Bought by
Vilaythong Myle
Home Financials for this Owner
Home Financials are based on the most recent Mortgage that was taken out on this home.
Original Mortgage
$108,000
Interest Rate
7.25%
Purchase Details
Closed on
Jan 23, 2000
Sold by
Babir Inc
Bought by
R M Financial Profiles Inc
Purchase Details
Closed on
Apr 30, 1998
Sold by
Jacobson Walter
Bought by
Babir Inc
Purchase Details
Closed on
Mar 30, 1998
Sold by
Brown Lee
Bought by
Carter Michael
Purchase Details
Closed on
Mar 4, 1998
Sold by
Jones Pauline
Bought by
Brown Lee
Create a Home Valuation Report for This Property
The Home Valuation Report is an in-depth analysis detailing your home's value as well as a comparison with similar homes in the area
Home Values in the Area
Average Home Value in this Area
Purchase History
| Date | Buyer | Sale Price | Title Company |
|---|---|---|---|
| Redditt Bertram | $143,000 | -- | |
| Vilaythong Myle | $130,000 | -- | |
| R M Financial Profiles Inc | -- | -- | |
| Babir Inc | -- | -- | |
| Carter Michael | -- | -- | |
| Brown Lee | -- | -- |
Source: Public Records
Mortgage History
| Date | Status | Borrower | Loan Amount |
|---|---|---|---|
| Previous Owner | Redditt Bertram | $108,000 | |
| Previous Owner | Vilaythong Myle | $117,000 |
Source: Public Records
Tax History Compared to Growth
Tax History
| Year | Tax Paid | Tax Assessment Tax Assessment Total Assessment is a certain percentage of the fair market value that is determined by local assessors to be the total taxable value of land and additions on the property. | Land | Improvement |
|---|---|---|---|---|
| 2024 | $218 | $12,801 | $5,438 | $7,363 |
| 2023 | $33 | $7,000 | $3,543 | $3,457 |
| 2022 | $33 | $7,000 | $3,543 | $3,457 |
| 2021 | $68 | $6,999 | $3,543 | $3,456 |
| 2020 | $1,355 | $11,646 | $4,406 | $7,240 |
| 2019 | $1,917 | $12,941 | $4,406 | $8,535 |
| 2018 | $1,884 | $12,941 | $4,406 | $8,535 |
| 2017 | $2,448 | $14,708 | $3,937 | $10,771 |
| 2016 | $2,446 | $14,708 | $3,937 | $10,771 |
| 2015 | $2,214 | $14,708 | $3,937 | $10,771 |
| 2014 | $1,862 | $12,605 | $3,750 | $8,855 |
| 2013 | $1,814 | $12,605 | $3,750 | $8,855 |
Source: Public Records
Map
Nearby Homes
- 4242 W 21st Place
- 4122 W Cermak Rd
- 1526 S Keeler Ave
- 1524 S Keeler Ave
- 1431 S Keeler Ave
- 1418 S Keeler Ave
- 4037 W 21st St
- 1241 S Kildare Ave
- 4209 W Cermak Rd
- 1825 S Komensky Ave
- 1855 S Komensky Ave
- 1810 S Kildare Ave
- 4014 W 21st St
- 2106 S Pulaski Rd
- 4022 W Cermak Rd
- 1625 S Keeler Ave
- 1620 S Kedvale Ave
- 1404 S Kedvale Ave
- 4226 W Ogden Ave
- 1818 S Harding Ave
- 4205 W Cullerton St
- 4207 W Cullerton St
- 4207 W Cullerton St
- 4157 W Cullerton St
- 4211 W Cullerton St Unit 2
- 4213 W Cullerton St
- 4155 W Cullerton St
- 4217 W Cullerton St
- 4217 W Cullerton St
- 4153 W Cullerton St
- 4204 W Cullerton St
- 4200 W 21st St
- 4204 W 21st St
- 1945 S Keeler Ave
- 4219 W Cullerton St
- 4219 W Cullerton St
- 4219 W Cullerton St Unit 2
- 4219 W Cullerton St Unit 1
- 4206 W 21st St
- 4206 W Cullerton St