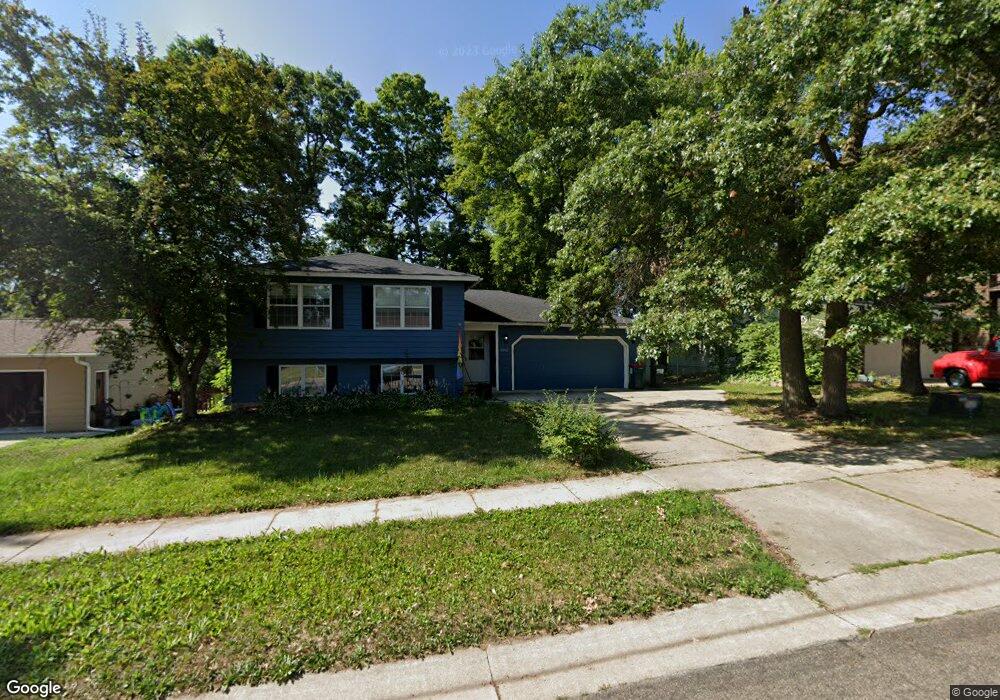
4202 2nd St NW Rochester, MN 55901
The Manor NeighborhoodEstimated Value: $343,000 - $351,000
3
Beds
2
Baths
1,953
Sq Ft
$177/Sq Ft
Est. Value
About This Home
This home is located at 4202 2nd St NW, Rochester, MN 55901 and is currently estimated at $346,066, approximately $177 per square foot. 4202 2nd St NW is a home located in Olmsted County with nearby schools including Bishop Elementary School, John Adams Middle School, and John Marshall Senior High School.
Ownership History
Date
Name
Owned For
Owner Type
Purchase Details
Closed on
Oct 26, 2020
Sold by
Nordlund Tanner and Nordlund Mariah
Bought by
Shoupa Zachary R and Flanagan Megan
Current Estimated Value
Home Financials for this Owner
Home Financials are based on the most recent Mortgage that was taken out on this home.
Original Mortgage
$253,000
Outstanding Balance
$225,134
Interest Rate
2.8%
Mortgage Type
New Conventional
Estimated Equity
$120,932
Purchase Details
Closed on
Oct 25, 2018
Sold by
Mcconahey Brent W and Mcconahey Kelli J
Bought by
Nordlund Mariah and Nordlund Tanner
Home Financials for this Owner
Home Financials are based on the most recent Mortgage that was taken out on this home.
Original Mortgage
$218,250
Interest Rate
4.7%
Mortgage Type
New Conventional
Purchase Details
Closed on
Apr 25, 2005
Sold by
Swift Jon N and Swift Nicolette M
Bought by
Watson Alfred T
Home Financials for this Owner
Home Financials are based on the most recent Mortgage that was taken out on this home.
Original Mortgage
$138,349
Interest Rate
5.87%
Mortgage Type
Adjustable Rate Mortgage/ARM
Create a Home Valuation Report for This Property
The Home Valuation Report is an in-depth analysis detailing your home's value as well as a comparison with similar homes in the area
Home Values in the Area
Average Home Value in this Area
Purchase History
| Date | Buyer | Sale Price | Title Company |
|---|---|---|---|
| Shoupa Zachary R | $266,324 | Ancona Title & Escrow | |
| Nordlund Mariah | $225,000 | Rochester Title & Escrow Co | |
| Watson Alfred T | $172,936 | Rochester Title & Escrow Co | |
| Shoupe Zachary Zachary | $266,300 | -- |
Source: Public Records
Mortgage History
| Date | Status | Borrower | Loan Amount |
|---|---|---|---|
| Open | Shoupa Zachary R | $253,000 | |
| Previous Owner | Nordlund Mariah | $218,250 | |
| Previous Owner | Watson Alfred T | $138,349 | |
| Closed | Shoupe Zachary Zachary | $253,000 |
Source: Public Records
Tax History Compared to Growth
Tax History
| Year | Tax Paid | Tax Assessment Tax Assessment Total Assessment is a certain percentage of the fair market value that is determined by local assessors to be the total taxable value of land and additions on the property. | Land | Improvement |
|---|---|---|---|---|
| 2024 | $4,156 | $312,300 | $50,000 | $262,300 |
| 2023 | $3,582 | $293,700 | $50,000 | $243,700 |
| 2022 | $3,264 | $271,000 | $50,000 | $221,000 |
| 2021 | $2,900 | $250,000 | $40,000 | $210,000 |
| 2020 | $2,968 | $225,000 | $40,000 | $185,000 |
| 2019 | $2,804 | $221,500 | $40,000 | $181,500 |
| 2018 | $2,336 | $211,600 | $40,000 | $171,600 |
| 2017 | $2,238 | $186,400 | $25,000 | $161,400 |
| 2016 | $2,400 | $149,900 | $21,800 | $128,100 |
| 2015 | $2,280 | $138,200 | $21,500 | $116,700 |
| 2014 | $2,186 | $162,400 | $25,000 | $137,400 |
| 2012 | -- | $131,800 | $21,244 | $110,556 |
Source: Public Records
Map
Nearby Homes
- 4119 Manor View Dr NW
- 4339 Manor Park Dr NW
- 4444 3rd St NW
- 188 37th Ave NW
- 3586 6th St NW
- 3938 7th St NW
- 650 36th Ave NW
- 660 36th Ave NW
- 3415 Lake St NW
- 3555 6th St NW
- 3740 8th St NW
- 468 Panorama Cir NW
- 700 Panorama Cir NW
- 4992 4th St NW
- 3304 Lake St NW
- 828 Diamond Ridge Ln NW
- 4541 Ruby Ln NW
- 360 Wimbledon Hills Dr SW
- 3324 Fox Hollow Ln SW
- 4921 8th St SW
- 4116 2nd St NW
- 4210 2nd St NW
- 4202 4202 2nd-Street-nw
- 4215 Manorwoods Dr NW
- 4116 4116 2nd-Street-nw
- 4108 2nd St NW
- 4209 Manorwoods Dr NW
- 4221 Manorwoods Dr NW
- 4218 2nd St NW
- 4203 Manorwoods Dr NW
- 4203 2nd St NW
- 4203 Manor Woods Dr NW
- 4115 2nd St NW
- 4301 Manorwoods Dr NW
- 4209 2nd St NW
- 4100 2nd St NW
- 4224 2nd St NW
- 4107 4107 2nd-Street-nw
- 4107 2nd St NW
- 4203 4203 Manor Woods Dr NW