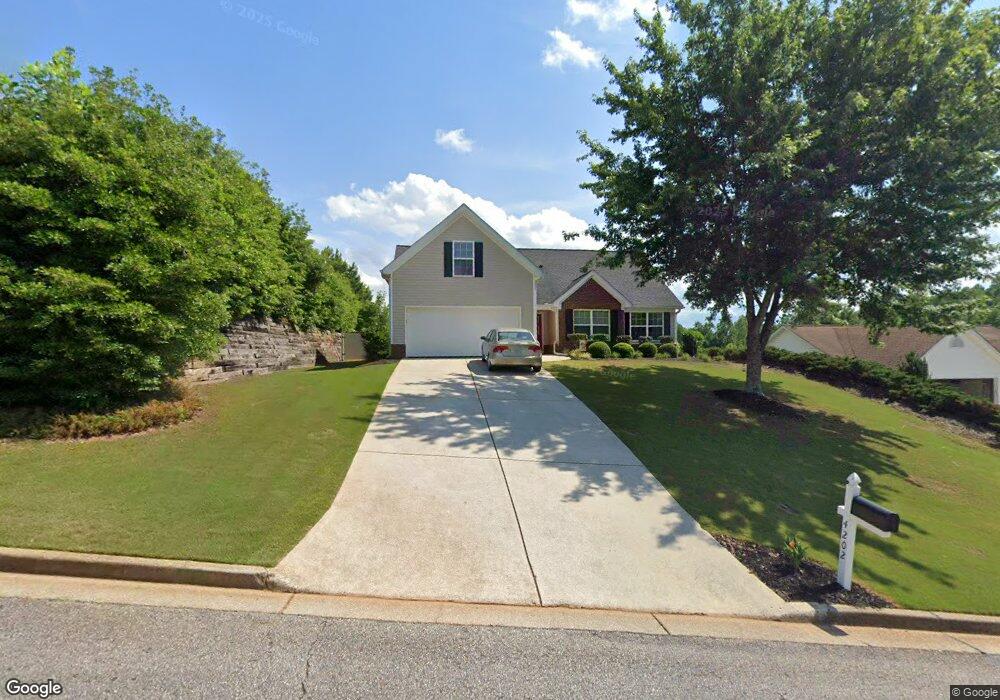
4202 Deer Springs Way Unit 9999 Gainesville, GA 30506
Estimated Value: $346,000 - $362,000
3
Beds
2
Baths
1,755
Sq Ft
$203/Sq Ft
Est. Value
About This Home
This home is located at 4202 Deer Springs Way Unit 9999, Gainesville, GA 30506 and is currently estimated at $356,105, approximately $202 per square foot. 4202 Deer Springs Way Unit 9999 is a home located in Hall County with nearby schools including Lanier Elementary School, Cartersville Primary School, and Chestatee Middle School.
Ownership History
Date
Name
Owned For
Owner Type
Purchase Details
Closed on
Aug 29, 2006
Sold by
Tyner Leila L
Bought by
Tyner Leila L and Tyner Jeffrey S
Current Estimated Value
Home Financials for this Owner
Home Financials are based on the most recent Mortgage that was taken out on this home.
Original Mortgage
$168,400
Interest Rate
6.58%
Mortgage Type
New Conventional
Purchase Details
Closed on
Nov 30, 2004
Sold by
Walnut Grove Builders Inc
Bought by
Tyner Leila L
Home Financials for this Owner
Home Financials are based on the most recent Mortgage that was taken out on this home.
Original Mortgage
$140,925
Interest Rate
5.66%
Mortgage Type
New Conventional
Purchase Details
Closed on
Jun 9, 2004
Sold by
Pinebrook Development Llc
Bought by
Walnut Grove Builders Inc
Home Financials for this Owner
Home Financials are based on the most recent Mortgage that was taken out on this home.
Original Mortgage
$111,900
Interest Rate
6.25%
Create a Home Valuation Report for This Property
The Home Valuation Report is an in-depth analysis detailing your home's value as well as a comparison with similar homes in the area
Home Values in the Area
Average Home Value in this Area
Purchase History
| Date | Buyer | Sale Price | Title Company |
|---|---|---|---|
| Tyner Leila L | -- | -- | |
| Tyner Leila L | -- | -- | |
| Tyner Leila L | $141,000 | -- | |
| Walnut Grove Builders Inc | $28,500 | -- |
Source: Public Records
Mortgage History
| Date | Status | Borrower | Loan Amount |
|---|---|---|---|
| Previous Owner | Tyner Leila L | $168,400 | |
| Previous Owner | Tyner Leila L | $140,925 | |
| Previous Owner | Walnut Grove Builders Inc | $111,900 |
Source: Public Records
Tax History Compared to Growth
Tax History
| Year | Tax Paid | Tax Assessment Tax Assessment Total Assessment is a certain percentage of the fair market value that is determined by local assessors to be the total taxable value of land and additions on the property. | Land | Improvement |
|---|---|---|---|---|
| 2024 | $3,330 | $131,640 | $26,880 | $104,760 |
| 2023 | $3,050 | $136,000 | $28,200 | $107,800 |
| 2022 | $2,414 | $90,720 | $8,960 | $81,760 |
| 2021 | $2,237 | $82,320 | $8,960 | $73,360 |
| 2020 | $2,203 | $78,760 | $8,440 | $70,320 |
| 2019 | $2,180 | $77,280 | $6,400 | $70,880 |
| 2018 | $2,144 | $73,560 | $6,280 | $67,280 |
| 2017 | $1,881 | $65,560 | $6,280 | $59,280 |
| 2016 | $1,664 | $60,480 | $3,800 | $56,680 |
| 2015 | $1,309 | $57,480 | $3,800 | $53,680 |
| 2014 | $1,309 | $47,040 | $3,800 | $43,240 |
Source: Public Records
Map
Nearby Homes
- 3740 Woodlane Rd
- 3933 Walnut Grove Way Unit 9999
- 3903 Walnut Grove Way
- 3804 Price Rd
- 3916 Petes Dr
- Cole Plan at Somerset at Riverbrook
- York Plan at Somerset at Riverbrook
- Cheyenne Plan at Somerset at Riverbrook
- 3831 Brookburn Park
- 3911 Fraser Cir
- 3649 Garden Blvd
- 4006 Summit Chase
- 3675 Rosedale Cir
- 3834 Covered Bridge Place
- 3557 Meadow Ln
- 3938 Pointe N
- 4051 Hidden Hollow Dr Unit A
- 4076 Fairmont St
- 4206 Deer Springs Way
- 4198 Deer Springs Way
- 0 Deer Springs Way Unit 8715864
- 0 Deer Springs Way Unit 9011510
- 0 Deer Springs Way Unit 8815347
- 0 Deer Springs Way Unit 8815338
- 0 Deer Springs Way Unit 8814649
- 0 Deer Springs Way Unit 2983188
- 0 Deer Springs Way Unit 7093926
- 0 Deer Springs Way Unit 7562669
- 0 Deer Springs Way Unit 8018143
- 0 Deer Springs Way Unit 8033187
- 0 Deer Springs Way Unit 8346352
- 0 Deer Springs Way Unit 8473570
- 4160 Deer Springs Way
- 4160 Deer Springs Way Unit 99
- 4210 Deer Springs Way Unit 99
- 4188 Deer Springs Way Unit 99
- 4156 Deer Springs Way
- 4170 Deer Springs Way Unit 9999