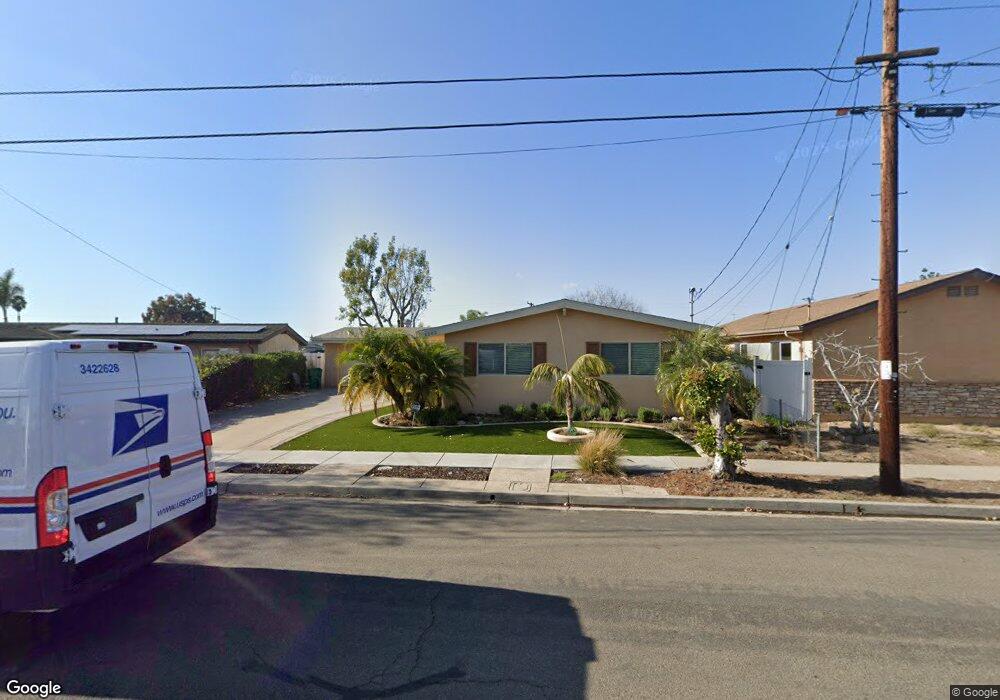
4202 Mount Putman Ave San Diego, CA 92117
Clairemont Mesa West NeighborhoodEstimated Value: $1,036,000 - $1,240,000
4
Beds
2
Baths
1,426
Sq Ft
$782/Sq Ft
Est. Value
About This Home
This home is located at 4202 Mount Putman Ave, San Diego, CA 92117 and is currently estimated at $1,114,683, approximately $781 per square foot. 4202 Mount Putman Ave is a home located in San Diego County with nearby schools including Holmes Elementary, Marston Middle School, and Clairemont High School.
Ownership History
Date
Name
Owned For
Owner Type
Purchase Details
Closed on
Jan 27, 2014
Sold by
Joffre Isabelle
Bought by
Joffre Isabelle
Current Estimated Value
Home Financials for this Owner
Home Financials are based on the most recent Mortgage that was taken out on this home.
Original Mortgage
$300,000
Outstanding Balance
$227,671
Interest Rate
4.45%
Mortgage Type
Seller Take Back
Estimated Equity
$887,012
Purchase Details
Closed on
Jan 24, 2014
Sold by
Rooster House Limited Partnership
Bought by
Joffre Isabelle
Home Financials for this Owner
Home Financials are based on the most recent Mortgage that was taken out on this home.
Original Mortgage
$300,000
Outstanding Balance
$227,671
Interest Rate
4.45%
Mortgage Type
Seller Take Back
Estimated Equity
$887,012
Purchase Details
Closed on
Oct 25, 2012
Sold by
Slawson Grant and Mccaffery Victoria
Bought by
Rooster House Limited Partnership
Purchase Details
Closed on
Nov 2, 2010
Sold by
Leu Ellen
Bought by
Slawson Grant
Purchase Details
Closed on
Jul 8, 2009
Sold by
Leu Ellen
Bought by
Leu Ellen
Purchase Details
Closed on
Apr 21, 2005
Sold by
Emig Ethel A
Bought by
Emig Ethel A
Create a Home Valuation Report for This Property
The Home Valuation Report is an in-depth analysis detailing your home's value as well as a comparison with similar homes in the area
Home Values in the Area
Average Home Value in this Area
Purchase History
| Date | Buyer | Sale Price | Title Company |
|---|---|---|---|
| Joffre Isabelle | -- | None Available | |
| Joffre Isabelle | $450,000 | None Available | |
| Rooster House Limited Partnership | -- | None Available | |
| Slawson Grant | $335,000 | Lawyers Title Insurance Corp | |
| Leu Ellen | -- | Lawyers Title Insurance Corp | |
| Leu Ellen | -- | None Available | |
| Emig Ethel A | -- | -- |
Source: Public Records
Mortgage History
| Date | Status | Borrower | Loan Amount |
|---|---|---|---|
| Open | Joffre Isabelle | $300,000 |
Source: Public Records
Tax History Compared to Growth
Tax History
| Year | Tax Paid | Tax Assessment Tax Assessment Total Assessment is a certain percentage of the fair market value that is determined by local assessors to be the total taxable value of land and additions on the property. | Land | Improvement |
|---|---|---|---|---|
| 2025 | $6,591 | $551,627 | $360,036 | $191,591 |
| 2024 | $6,591 | $540,812 | $352,977 | $187,835 |
| 2023 | $6,443 | $530,208 | $346,056 | $184,152 |
| 2022 | $6,271 | $519,813 | $339,271 | $180,542 |
| 2021 | $6,226 | $509,621 | $332,619 | $177,002 |
| 2020 | $6,150 | $504,397 | $329,209 | $175,188 |
| 2019 | $6,039 | $494,507 | $322,754 | $171,753 |
| 2018 | $5,645 | $484,812 | $316,426 | $168,386 |
| 2017 | $5,509 | $475,307 | $310,222 | $165,085 |
| 2016 | $5,419 | $465,989 | $304,140 | $161,849 |
| 2015 | $5,339 | $458,990 | $299,572 | $159,418 |
| 2014 | $4,750 | $400,322 | $261,280 | $139,042 |
Source: Public Records
Map
Nearby Homes
- 4226 Mount Voss Dr
- 4695 Mount Armet Dr
- 4141 Mount Bigelow Way
- 4380 Rolfe Rd
- 4203 Tolowa St
- 4915 Mount Gaywas Dr
- 4772 Mount Gaywas Dr
- 4472 Mount Lindsey Ave
- 4182 Seri St
- 3855 Mount Blackburn Ave
- 5230 Mount Alifan Dr
- 5289 Mount Alifan Dr
- 5273 Mount Alifan Dr
- 5377 Balboa Ave
- 5252 Mount Blanca Dr
- 4110 Genesee Ave
- 4108 Genesee Ave
- 3942 Mount Acadia Blvd
- 4527 Chinook Ct
- 3652 Clairemont Dr Unit 1B
- 4210 Mount Putman Ave
- 4192 Mount Putman Ave
- 4187 Mount Hukee Ave
- 4175 Mount Hukee Ave
- 4201 Mt Hukee
- 4201 Mount Hukee Ave
- 4218 Mount Putman Ave
- 4180 Mount Putman Ave
- 4652 Mount Putman Ct
- 4163 Mount Hukee Ave
- 4211 Mount Hukee Ave
- 4226 Mount Putman Ave
- 4215 Mount Putman Ave
- 4151 Mount Hukee Ave
- 4168 Mount Putman Ave
- 4221 Mount Hukee Ave
- 4662 Mount Putman Ct
- 4167 Mount Putman Ave
- 4223 Mount Putman Ave
- 4234 Mount Putman Ave