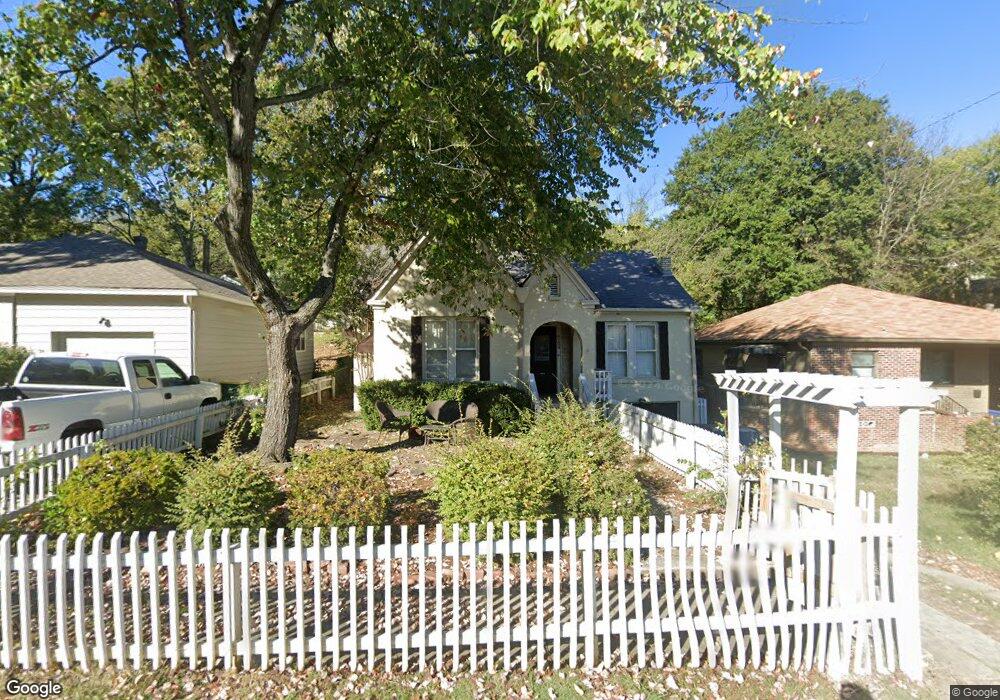
4204 B St Little Rock, AR 72205
Hillcrest NeighborhoodEstimated Value: $225,000 - $257,023
--
Bed
1
Bath
1,141
Sq Ft
$209/Sq Ft
Est. Value
About This Home
This home is located at 4204 B St, Little Rock, AR 72205 and is currently estimated at $239,006, approximately $209 per square foot. 4204 B St is a home located in Pulaski County with nearby schools including Pulaski Heights Elementary School, Pulaski Heights Middle School, and Central High School.
Ownership History
Date
Name
Owned For
Owner Type
Purchase Details
Closed on
Jan 5, 2018
Sold by
Jones Karen E
Bought by
Westerfield Vicki
Current Estimated Value
Purchase Details
Closed on
Jul 21, 2003
Sold by
Baldwin Kyle W
Bought by
Jones Karen E
Home Financials for this Owner
Home Financials are based on the most recent Mortgage that was taken out on this home.
Original Mortgage
$109,000
Interest Rate
5.15%
Mortgage Type
Purchase Money Mortgage
Create a Home Valuation Report for This Property
The Home Valuation Report is an in-depth analysis detailing your home's value as well as a comparison with similar homes in the area
Home Values in the Area
Average Home Value in this Area
Purchase History
| Date | Buyer | Sale Price | Title Company |
|---|---|---|---|
| Westerfield Vicki | $155,900 | Lenders Title Company | |
| Jones Karen E | $109,000 | Lenders Title Co |
Source: Public Records
Mortgage History
| Date | Status | Borrower | Loan Amount |
|---|---|---|---|
| Previous Owner | Jones Karen E | $109,000 |
Source: Public Records
Tax History Compared to Growth
Tax History
| Year | Tax Paid | Tax Assessment Tax Assessment Total Assessment is a certain percentage of the fair market value that is determined by local assessors to be the total taxable value of land and additions on the property. | Land | Improvement |
|---|---|---|---|---|
| 2025 | $3,099 | $47,542 | $14,600 | $32,942 |
| 2024 | $2,657 | $47,542 | $14,600 | $32,942 |
| 2023 | $2,657 | $47,542 | $14,600 | $32,942 |
| 2022 | $2,435 | $47,542 | $14,600 | $32,942 |
| 2021 | $2,214 | $31,630 | $10,100 | $21,530 |
| 2020 | $2,214 | $31,630 | $10,100 | $21,530 |
| 2019 | $2,214 | $31,630 | $10,100 | $21,530 |
| 2018 | $2,214 | $31,630 | $10,100 | $21,530 |
| 2017 | $1,787 | $31,630 | $10,100 | $21,530 |
| 2016 | $1,686 | $32,870 | $7,800 | $25,070 |
| 2015 | $1,794 | $27,919 | $7,800 | $20,119 |
| 2014 | $1,794 | $25,599 | $7,800 | $17,799 |
Source: Public Records
Map
Nearby Homes
- 220 Rose St
- 402 Rose St
- 4213 A St
- 304 Walnut St
- 326 Ash St
- 118 N Pine St
- 201 Beechwood St
- 4001 Cedar Hill Rd
- 313 Colonial Ct
- 100 Colonial Ct
- 501 N Palm St
- 206 Linwood Ct
- 621 N Pine St
- 310 S Oak St
- 220 S Valentine St
- 3901 Cedar Hill #23 Rd
- 131 Fairview Rd
- 3901 Cedar Hill Rd
- 222 Valmar St
- 507 Uams Blvd