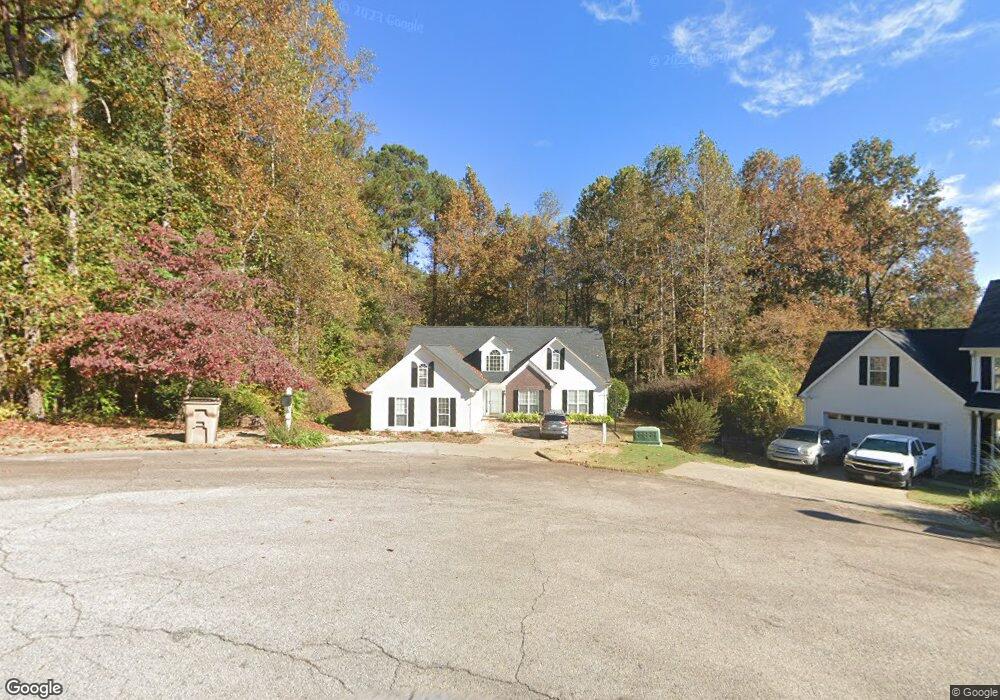
4204 Riviere Point Gainesville, GA 30507
Southeast Gainesville NeighborhoodEstimated Value: $371,000 - $413,220
3
Beds
3
Baths
1,726
Sq Ft
$224/Sq Ft
Est. Value
About This Home
This home is located at 4204 Riviere Point, Gainesville, GA 30507 and is currently estimated at $386,805, approximately $224 per square foot. 4204 Riviere Point is a home located in Hall County with nearby schools including Myers Elementary School, Cherokee Bluff Middle School, and Cherokee Bluff High School.
Ownership History
Date
Name
Owned For
Owner Type
Purchase Details
Closed on
Jul 16, 2007
Sold by
Pellegrino Charon M
Bought by
Boyd Walter L and Boyd Charlotte P
Current Estimated Value
Purchase Details
Closed on
Aug 3, 2005
Sold by
Pellegrino Charon M and Pellegrino Albert A
Bought by
Pellegrino Charon M
Home Financials for this Owner
Home Financials are based on the most recent Mortgage that was taken out on this home.
Original Mortgage
$42,500
Interest Rate
5.57%
Mortgage Type
New Conventional
Purchase Details
Closed on
Jun 9, 2000
Sold by
Jay Bullock Communities Inc
Bought by
Pellegrino Charon M and Pellegrino Albert A
Home Financials for this Owner
Home Financials are based on the most recent Mortgage that was taken out on this home.
Original Mortgage
$133,000
Interest Rate
8.11%
Mortgage Type
New Conventional
Purchase Details
Closed on
Mar 15, 2000
Sold by
Balata Development Corporation
Bought by
Bullock Jay Communities Inc
Create a Home Valuation Report for This Property
The Home Valuation Report is an in-depth analysis detailing your home's value as well as a comparison with similar homes in the area
Home Values in the Area
Average Home Value in this Area
Purchase History
| Date | Buyer | Sale Price | Title Company |
|---|---|---|---|
| Boyd Walter L | $175,000 | -- | |
| Pellegrino Charon M | -- | -- | |
| Pellegrino Charon M | $141,700 | -- | |
| Bullock Jay Communities Inc | $247,500 | -- |
Source: Public Records
Mortgage History
| Date | Status | Borrower | Loan Amount |
|---|---|---|---|
| Previous Owner | Pellegrino Charon M | $42,500 | |
| Previous Owner | Pellegrino Charon M | $133,000 |
Source: Public Records
Tax History
| Year | Tax Paid | Tax Assessment Tax Assessment Total Assessment is a certain percentage of the fair market value that is determined by local assessors to be the total taxable value of land and additions on the property. | Land | Improvement |
|---|---|---|---|---|
| 2025 | $1,103 | $156,440 | $31,160 | $125,280 |
| 2024 | $1,173 | $129,880 | $27,320 | $102,560 |
| 2023 | $1,021 | $124,320 | $27,320 | $97,000 |
| 2022 | $1,161 | $118,400 | $30,800 | $87,600 |
| 2021 | $1,009 | $95,560 | $18,600 | $76,960 |
| 2020 | $1,062 | $99,040 | $18,400 | $80,640 |
| 2019 | $849 | $74,720 | $9,240 | $65,480 |
| 2018 | $830 | $70,840 | $12,320 | $58,520 |
| 2017 | $731 | $64,920 | $12,320 | $52,600 |
| 2016 | $617 | $58,800 | $6,200 | $52,600 |
| 2015 | $596 | $56,534 | $6,200 | $50,334 |
| 2014 | $596 | $56,534 | $6,200 | $50,334 |
Source: Public Records
Map
Nearby Homes
- 4528 White Horse Dr
- 4070 Silverstone Dr
- 4326 Caney Fork Cir
- 3792 Tanners Mill Rd
- 255 Remington Park Dr
- 387 Lauren Marie Dr
- 3325 Tanners Mill Rd
- 1 Cooper Bridge Rd
- 3 Cooper Bridge Rd
- 5447 Winder Hwy
- 1305 Overland Park Dr
- 3263 Tanners Mill Rd
- 67 Pointer Ln
- 5465 Winder Hwy
- 3455 Navigator Ln
- 3255 Tanners Mill Rd
- 606 Walnut Creek Pkwy
- 626 Walnut Creek Pkwy
- 562 Walnut Creek Pkwy
- 3917 Kilgore Falls Dr
- 4200 Riviere Point
- 4205 Riviere Point
- 4212 Riviere Point
- 4213 Riviere Point
- 4209 Riviere Point
- 4179 Evian Way
- 4217 Riviere Point
- 4221 Riviere Point
- 4094 River Elan Dr
- 4173 Evian Way
- 4180 Evian Way
- 4090 River Elan Dr
- 4099 River Elan Dr
- 4225 Riviere Point
- 4159 Evian Way
- 4167 Evian Way
- 4228 Riviere Point
- 4229 Riviere Point
- 4095 River Elan Dr
- 4176 Evian Way
Your Personal Tour Guide
Ask me questions while you tour the home.