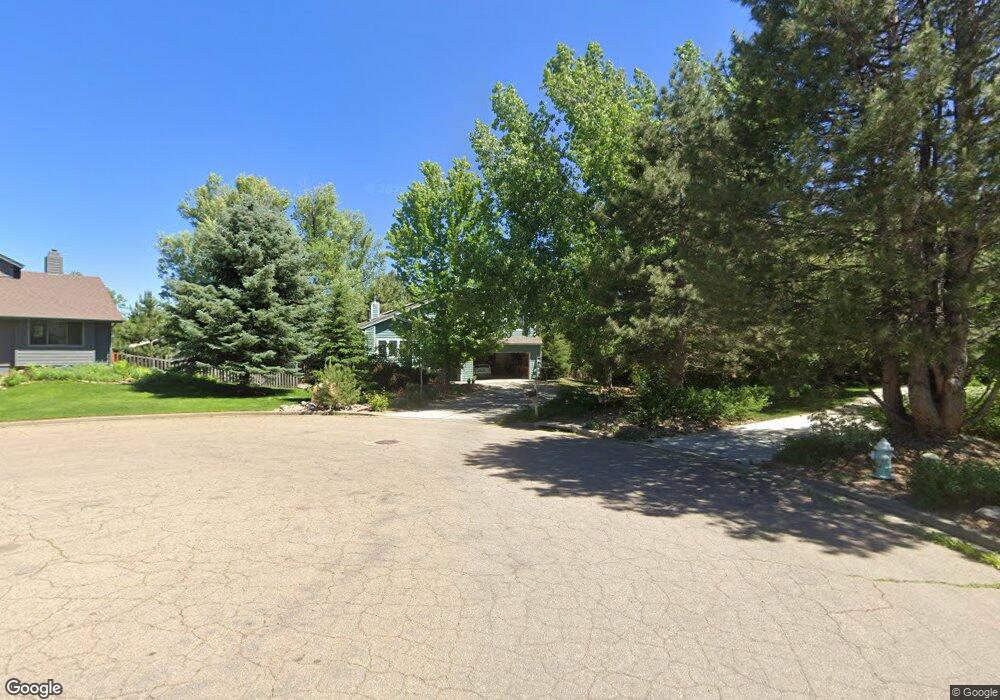
4204 Tamarack Ct Boulder, CO 80304
North Boulder NeighborhoodEstimated Value: $1,684,000 - $2,116,000
4
Beds
3
Baths
3,257
Sq Ft
$563/Sq Ft
Est. Value
About This Home
This home is located at 4204 Tamarack Ct, Boulder, CO 80304 and is currently estimated at $1,833,920, approximately $563 per square foot. 4204 Tamarack Ct is a home located in Boulder County with nearby schools including Crest View Elementary School, Centennial Middle School, and Boulder High School.
Ownership History
Date
Name
Owned For
Owner Type
Purchase Details
Closed on
Sep 5, 1997
Sold by
Kimmel Mark
Bought by
Toll Erich E
Current Estimated Value
Home Financials for this Owner
Home Financials are based on the most recent Mortgage that was taken out on this home.
Original Mortgage
$267,750
Outstanding Balance
$34,593
Interest Rate
7.34%
Estimated Equity
$1,799,327
Purchase Details
Closed on
Jun 15, 1993
Bought by
Aitken Leonard Lyall and Aitken Susan Helen
Purchase Details
Closed on
Mar 2, 1989
Bought by
Aitken Leonard Lyall and Aitken Susan Helen
Purchase Details
Closed on
Apr 18, 1988
Bought by
Aitken Leonard Lyall and Aitken Susan Helen
Create a Home Valuation Report for This Property
The Home Valuation Report is an in-depth analysis detailing your home's value as well as a comparison with similar homes in the area
Home Values in the Area
Average Home Value in this Area
Purchase History
| Date | Buyer | Sale Price | Title Company |
|---|---|---|---|
| Toll Erich E | $357,000 | -- | |
| Aitken Leonard Lyall | $290,000 | -- | |
| Aitken Leonard Lyall | $190,600 | -- | |
| Aitken Leonard Lyall | $187,000 | -- |
Source: Public Records
Mortgage History
| Date | Status | Borrower | Loan Amount |
|---|---|---|---|
| Open | Toll Erich E | $267,750 |
Source: Public Records
Tax History
| Year | Tax Paid | Tax Assessment Tax Assessment Total Assessment is a certain percentage of the fair market value that is determined by local assessors to be the total taxable value of land and additions on the property. | Land | Improvement |
|---|---|---|---|---|
| 2025 | $10,200 | $112,419 | $66,400 | $46,019 |
| 2024 | $10,200 | $112,419 | $66,400 | $46,019 |
| 2023 | $10,023 | $122,757 | $68,635 | $57,808 |
| 2022 | $8,466 | $98,114 | $55,378 | $42,736 |
| 2021 | $8,073 | $100,936 | $56,971 | $43,965 |
| 2020 | $7,197 | $89,826 | $50,408 | $39,418 |
| 2019 | $7,086 | $89,826 | $50,408 | $39,418 |
| 2018 | $7,330 | $84,542 | $50,760 | $33,782 |
| 2017 | $7,100 | $93,466 | $56,118 | $37,348 |
| 2016 | $7,032 | $81,239 | $42,108 | $39,131 |
| 2015 | $6,659 | $61,444 | $27,144 | $34,300 |
| 2014 | $5,166 | $61,444 | $27,144 | $34,300 |
Source: Public Records
Map
Nearby Homes
- 2362 Spotswood Place
- 2770 Arbor Glen Place
- 2158 Tamarack Ave
- 2190 Vine Ave
- 2170 Vine Ave
- 2558 Premier Place
- 2155 Vine Ave
- 2125 Vine Ave
- 2116 Vine Ave
- 2126 Vine Ave
- 2715 Northbrook Place
- 2734 Northbrook Place
- 1800 Sumac Ave
- 3805 Northbrook Dr Unit D
- 3835 Northbrook Dr Unit E
- 3788 26th St
- 1801 Redwood Ave
- 3901 Paseo Del Prado St
- 4500 19th St Unit 111
- 4500 19th St
- 4224 Tamarack Ct
- 2557 Sumac Ave
- 2579 Sumac Ave
- 4209 26th St
- 4209 Tamarack Ct
- 4225 26th St
- 4221 Tamarack Ct
- 4244 Tamarack Ct
- 2535 Sumac Ave
- 2591 Sumac Ave
- 2590 Tamarack Ave
- 2440 Tamarack Ave
- 4249 Tamarack Ct
- 2475 Topaz Dr
- 2582 Sumac Ave
- 2570 Sumac Ave
- 2590 Sumac Ave
- 4202 26th St
- 2503 Sumac Ave
- 4210 26th St
Your Personal Tour Guide
Ask me questions while you tour the home.