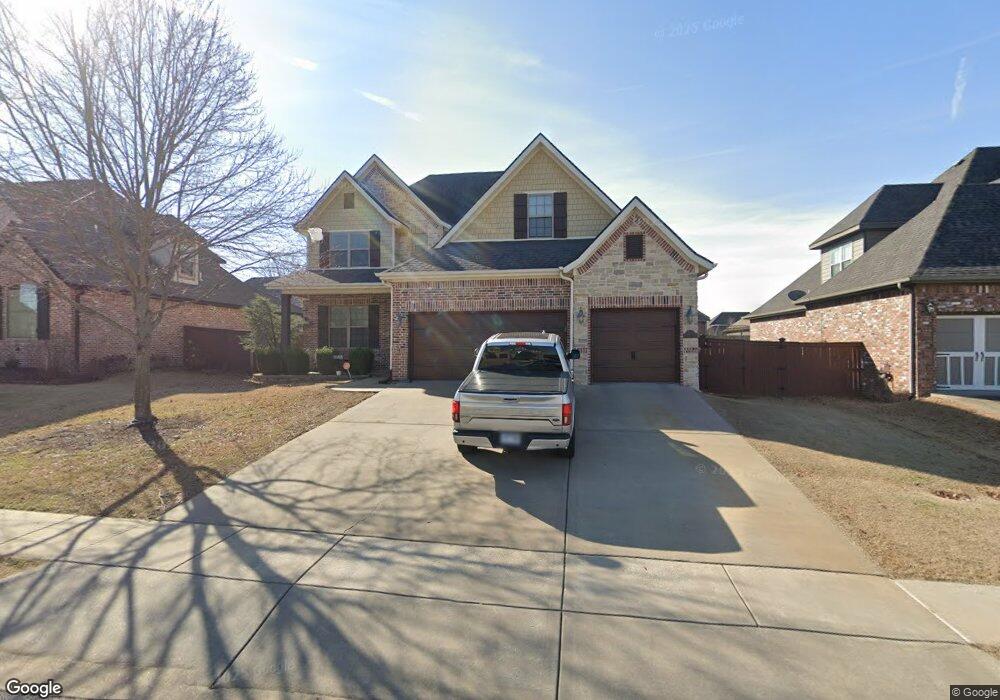
4204 W Candlewood Place Rogers, AR 72758
Estimated Value: $706,000 - $731,000
4
Beds
4
Baths
3,380
Sq Ft
$214/Sq Ft
Est. Value
About This Home
This home is located at 4204 W Candlewood Place, Rogers, AR 72758 and is currently estimated at $723,201, approximately $213 per square foot. 4204 W Candlewood Place is a home located in Benton County with nearby schools including Fairview Elementary School, Elmwood Middle School, and Rogers High School.
Ownership History
Date
Name
Owned For
Owner Type
Purchase Details
Closed on
Jul 21, 2018
Sold by
Carr Adam B and Carr Cynthia D
Bought by
Carr Adam B and Carr Cynthia D
Current Estimated Value
Home Financials for this Owner
Home Financials are based on the most recent Mortgage that was taken out on this home.
Original Mortgage
$212,096
Outstanding Balance
$128,334
Interest Rate
4.5%
Estimated Equity
$594,867
Purchase Details
Closed on
Sep 23, 2011
Sold by
Reynolds Family Development Llc
Bought by
Carr Adam B
Home Financials for this Owner
Home Financials are based on the most recent Mortgage that was taken out on this home.
Original Mortgage
$260,000
Interest Rate
2.87%
Mortgage Type
Adjustable Rate Mortgage/ARM
Purchase Details
Closed on
Dec 20, 2010
Sold by
York Construction Inc
Bought by
Reynolds Family Development Llc
Purchase Details
Closed on
Nov 2, 2009
Sold by
Wilcox Mark
Bought by
York Construction Inc
Create a Home Valuation Report for This Property
The Home Valuation Report is an in-depth analysis detailing your home's value as well as a comparison with similar homes in the area
Home Values in the Area
Average Home Value in this Area
Purchase History
| Date | Buyer | Sale Price | Title Company |
|---|---|---|---|
| Carr Adam B | -- | None Available | |
| Carr Adam B | $325,000 | Elite Title Company Inc | |
| Reynolds Family Development Llc | $37,000 | Elite Title Company Inc | |
| York Construction Inc | $2,161 | None Available |
Source: Public Records
Mortgage History
| Date | Status | Borrower | Loan Amount |
|---|---|---|---|
| Open | Carr Adam B | $212,096 | |
| Previous Owner | Carr Adam B | $260,000 |
Source: Public Records
Tax History Compared to Growth
Tax History
| Year | Tax Paid | Tax Assessment Tax Assessment Total Assessment is a certain percentage of the fair market value that is determined by local assessors to be the total taxable value of land and additions on the property. | Land | Improvement |
|---|---|---|---|---|
| 2025 | $4,811 | $121,008 | $20,000 | $101,008 |
| 2024 | $4,481 | $121,008 | $20,000 | $101,008 |
| 2023 | $4,268 | $80,680 | $15,000 | $65,680 |
| 2022 | $4,062 | $80,680 | $15,000 | $65,680 |
| 2021 | $4,003 | $80,680 | $15,000 | $65,680 |
| 2020 | $3,798 | $76,010 | $8,600 | $67,410 |
| 2019 | $3,798 | $76,010 | $8,600 | $67,410 |
| 2018 | $3,719 | $76,010 | $8,600 | $67,410 |
| 2017 | $3,578 | $76,010 | $8,600 | $67,410 |
| 2016 | $3,163 | $76,010 | $8,600 | $67,410 |
| 2015 | $3,410 | $64,460 | $8,400 | $56,060 |
| 2014 | $3,060 | $64,460 | $8,400 | $56,060 |
Source: Public Records
Map
Nearby Homes
- 4109 W Candlewood Place
- 6401 S 42nd St
- Single Family Portfo Group 2
- 6114 S 40th Place
- Single Family Portfo Group 1
- 6099 S Pack Ln
- 0 W Garrett Rd Unit 1321383
- 4107 W Murfield Dr
- 6098 S Pack Ln
- 4105 W Murfield Dr
- 4116 W Erin Dr
- 4112 W Erin Dr
- 4110 W Erin Dr
- 4108 W Erin Dr
- 4114 W Erin Dr
- 1602 Timberline Ave
- 4587 W Garrett Rd
- 6402 S 35th St
- 6400 S 46th Blvd
- 3500 Kirkwood St
- 4202 W Candlewood Place
- 4206 W Candlewood Place
- 4211 Willowbend
- 4211 W Willowbend Dr
- 4209 Willowbend
- 4209 W Willowbend Dr
- 4200 W Candlewood Place
- 4208 W Candlewood Place
- 4213 Willowbend
- 4207 Willowbend
- 4207 W Willowbend Dr
- 4205 W Candlewood Place
- 4207 W Candlewood Place
- 4203 W Candlewood Place
- 4215 Willowbend
- 4108 Candlewood Place
- 4108 W Candlewood Place
- 4210 W Candlewood Place
- 4209 W Candlewood Place
- 4205 W Willowbend Dr