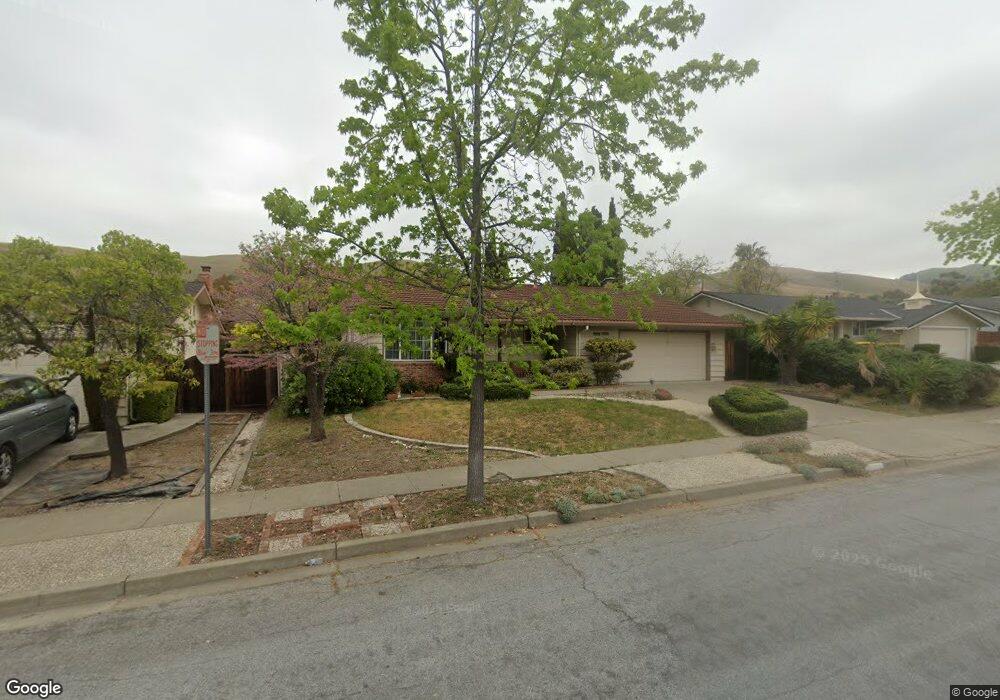
42042 Via San Luis Rey Fremont, CA 94539
Mission Valley NeighborhoodEstimated Value: $2,148,255 - $2,672,000
4
Beds
2
Baths
1,769
Sq Ft
$1,375/Sq Ft
Est. Value
About This Home
This home is located at 42042 Via San Luis Rey, Fremont, CA 94539 and is currently estimated at $2,432,314, approximately $1,374 per square foot. 42042 Via San Luis Rey is a home located in Alameda County with nearby schools including Joshua Chadbourne Elementary School, William Hopkins Junior High School, and Mission San Jose High School.
Ownership History
Date
Name
Owned For
Owner Type
Purchase Details
Closed on
Mar 28, 2002
Sold by
Kim Seiyong and Kim Yongeun
Bought by
Liu Lee Yeong Sheng and Liu Lee Lily
Current Estimated Value
Home Financials for this Owner
Home Financials are based on the most recent Mortgage that was taken out on this home.
Original Mortgage
$511,000
Outstanding Balance
$212,740
Interest Rate
6.87%
Estimated Equity
$2,219,574
Purchase Details
Closed on
May 24, 2000
Sold by
Lafauci Stella D
Bought by
Kim Seiyong and Kim Yongeun
Home Financials for this Owner
Home Financials are based on the most recent Mortgage that was taken out on this home.
Original Mortgage
$685,000
Interest Rate
8.08%
Mortgage Type
Stand Alone First
Create a Home Valuation Report for This Property
The Home Valuation Report is an in-depth analysis detailing your home's value as well as a comparison with similar homes in the area
Home Values in the Area
Average Home Value in this Area
Purchase History
| Date | Buyer | Sale Price | Title Company |
|---|---|---|---|
| Liu Lee Yeong Sheng | $730,000 | Placer Title Company | |
| Kim Seiyong | $685,000 | Old Republic Title Company |
Source: Public Records
Mortgage History
| Date | Status | Borrower | Loan Amount |
|---|---|---|---|
| Open | Liu Lee Yeong Sheng | $511,000 | |
| Previous Owner | Kim Seiyong | $685,000 |
Source: Public Records
Tax History Compared to Growth
Tax History
| Year | Tax Paid | Tax Assessment Tax Assessment Total Assessment is a certain percentage of the fair market value that is determined by local assessors to be the total taxable value of land and additions on the property. | Land | Improvement |
|---|---|---|---|---|
| 2025 | $12,723 | $1,071,355 | $323,506 | $754,849 |
| 2024 | $12,723 | $1,050,214 | $317,164 | $740,050 |
| 2023 | $12,388 | $1,036,490 | $310,947 | $725,543 |
| 2022 | $12,236 | $1,009,167 | $304,850 | $711,317 |
| 2021 | $11,933 | $989,244 | $298,873 | $697,371 |
| 2020 | $11,995 | $986,032 | $295,809 | $690,223 |
| 2019 | $11,856 | $966,701 | $290,010 | $676,691 |
| 2018 | $11,625 | $947,751 | $284,325 | $663,426 |
| 2017 | $11,334 | $929,172 | $278,751 | $650,421 |
| 2016 | $11,145 | $910,958 | $273,287 | $637,671 |
| 2015 | $11,001 | $897,278 | $269,183 | $628,095 |
| 2014 | $10,815 | $879,707 | $263,912 | $615,795 |
Source: Public Records
Map
Nearby Homes
- 42226 Camino Santa Barbara
- 231 Cavalo Ct
- 335 Via Rosario
- 42955 Corte Verde
- 42965 Corte Verde
- 124 Linmore Dr
- 43150 Starr St
- 138 Telles Ln
- 41246 Mission Blvd
- 41252 Mission Blvd
- 341 Dana St
- 905 Glenhill Dr
- 2225 Valorie St
- 1123 Farragut Dr
- 1137 Farragut Dr
- 42329 Troyer Ave
- 43547 Ellsworth St
- 41519 Apricot Ln
- 260 Jacaranda Dr
- 483 Becado Place
- 42054 Via San Luis Rey
- 42030 Via San Luis Rey
- 42039 Via San Carlos
- 42027 Via San Carlos
- 42051 Via San Carlos
- 42066 Via San Luis Rey
- 42018 Via San Luis Rey
- 42053 Via San Luis Rey
- 42039 Via San Luis Rey
- 42015 Via San Carlos
- 42063 Via San Carlos
- 42067 Via San Luis Rey
- 42025 Via San Luis Rey
- 42078 Via San Luis Rey
- 42006 Via San Luis Rey
- 42003 Via San Carlos
- 42075 Via San Carlos
- 42017 Via San Luis Rey
- 41994 Via San Luis Rey
- 42090 Via San Luis Rey