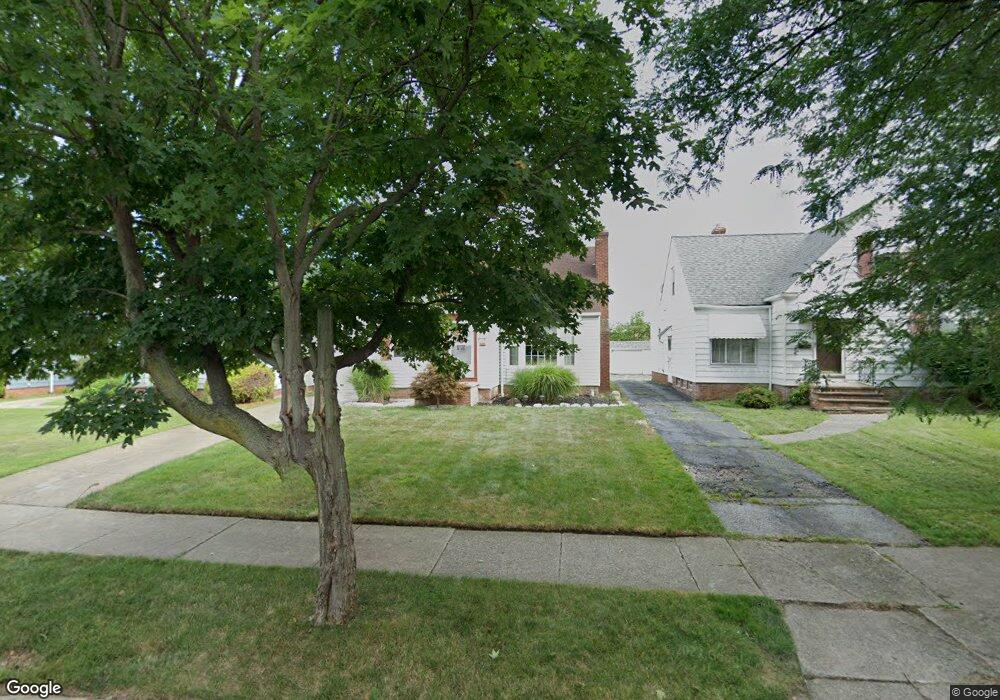
4205 Stilmore Rd Cleveland, OH 44121
Estimated Value: $144,720 - $216,000
2
Beds
1
Bath
1,015
Sq Ft
$167/Sq Ft
Est. Value
About This Home
This home is located at 4205 Stilmore Rd, Cleveland, OH 44121 and is currently estimated at $169,680, approximately $167 per square foot. 4205 Stilmore Rd is a home located in Cuyahoga County with nearby schools including Rowland Elementary School, Greenview Upper Elementary School, and Memorial Junior High School.
Ownership History
Date
Name
Owned For
Owner Type
Purchase Details
Closed on
Mar 28, 2005
Sold by
Merry William Earl and Merry Cynthia
Bought by
Thomas Vincent S
Current Estimated Value
Home Financials for this Owner
Home Financials are based on the most recent Mortgage that was taken out on this home.
Original Mortgage
$110,000
Outstanding Balance
$56,137
Interest Rate
5.61%
Mortgage Type
Purchase Money Mortgage
Estimated Equity
$113,543
Purchase Details
Closed on
May 18, 1998
Sold by
Fishman Rina
Bought by
Merry William Earl
Home Financials for this Owner
Home Financials are based on the most recent Mortgage that was taken out on this home.
Original Mortgage
$79,800
Interest Rate
7.27%
Purchase Details
Closed on
Dec 15, 1993
Sold by
Fishman Jacob
Bought by
Fishman Rina
Purchase Details
Closed on
Jan 31, 1977
Sold by
Siegler Sanford I and Siegler Sally S
Bought by
Fishman Jacob
Purchase Details
Closed on
Jan 1, 1975
Bought by
Siegler Sanford I and Siegler Sally S
Create a Home Valuation Report for This Property
The Home Valuation Report is an in-depth analysis detailing your home's value as well as a comparison with similar homes in the area
Home Values in the Area
Average Home Value in this Area
Purchase History
| Date | Buyer | Sale Price | Title Company |
|---|---|---|---|
| Thomas Vincent S | $110,000 | Executive Title Agency | |
| Merry William Earl | $84,000 | -- | |
| Fishman Rina | -- | -- | |
| Fishman Jacob | $37,500 | -- | |
| Siegler Sanford I | -- | -- |
Source: Public Records
Mortgage History
| Date | Status | Borrower | Loan Amount |
|---|---|---|---|
| Open | Thomas Vincent S | $110,000 | |
| Previous Owner | Merry William Earl | $79,800 |
Source: Public Records
Tax History Compared to Growth
Tax History
| Year | Tax Paid | Tax Assessment Tax Assessment Total Assessment is a certain percentage of the fair market value that is determined by local assessors to be the total taxable value of land and additions on the property. | Land | Improvement |
|---|---|---|---|---|
| 2024 | $3,639 | $46,865 | $9,870 | $36,995 |
| 2023 | $3,285 | $34,130 | $7,180 | $26,950 |
| 2022 | $3,268 | $34,125 | $7,175 | $26,950 |
| 2021 | $3,243 | $34,130 | $7,180 | $26,950 |
| 2020 | $3,037 | $27,760 | $5,850 | $21,910 |
| 2019 | $2,777 | $79,300 | $16,700 | $62,600 |
| 2018 | $2,764 | $27,760 | $5,850 | $21,910 |
| 2017 | $2,891 | $26,740 | $4,760 | $21,980 |
| 2016 | $2,873 | $26,740 | $4,760 | $21,980 |
| 2015 | $2,921 | $26,740 | $4,760 | $21,980 |
| 2014 | $2,921 | $28,150 | $5,010 | $23,140 |
Source: Public Records
Map
Nearby Homes
- 4194 Stilmore Rd
- 4206 Verona Rd
- 4237 Verona Rd
- 4210 Stonehaven Rd
- 4249 Wyncote Rd
- 4158 Wyncote Rd
- 4124 Bayard Rd
- 4233 Bayard Rd
- 1940 Temblethurst Rd
- 4197 Okalona Rd
- 4121 Hinsdale Rd
- 4033 Stonehaven Rd
- 1895 Temblethurst Rd
- 14213 Cedar Rd
- 4040 Bayard Rd
- 2108 S Belvoir Blvd
- 4084 Okalona Rd
- 2091 S Belvoir Blvd
- 4015 Bayard Rd
- 1819 Warrensville Center Rd
- 4201 Stilmore Rd
- 4197 Stilmore Rd
- 4213 Stilmore Rd
- 4193 Stilmore Rd
- 4217 Stilmore Rd
- 4206 Wilmington Rd
- 4202 Wilmington Rd
- 4210 Wilmington Rd
- 4198 Wilmington Rd
- 4189 Stilmore Rd
- 4214 Wilmington Rd
- 4221 Stilmore Rd
- 4194 Wilmington Rd
- 4218 Wilmington Rd
- 4206 Stilmore Rd
- 4202 Stilmore Rd
- 4210 Stilmore Rd
- 4185 Stilmore Rd
- 4190 Wilmington Rd
- 4225 Stilmore Rd