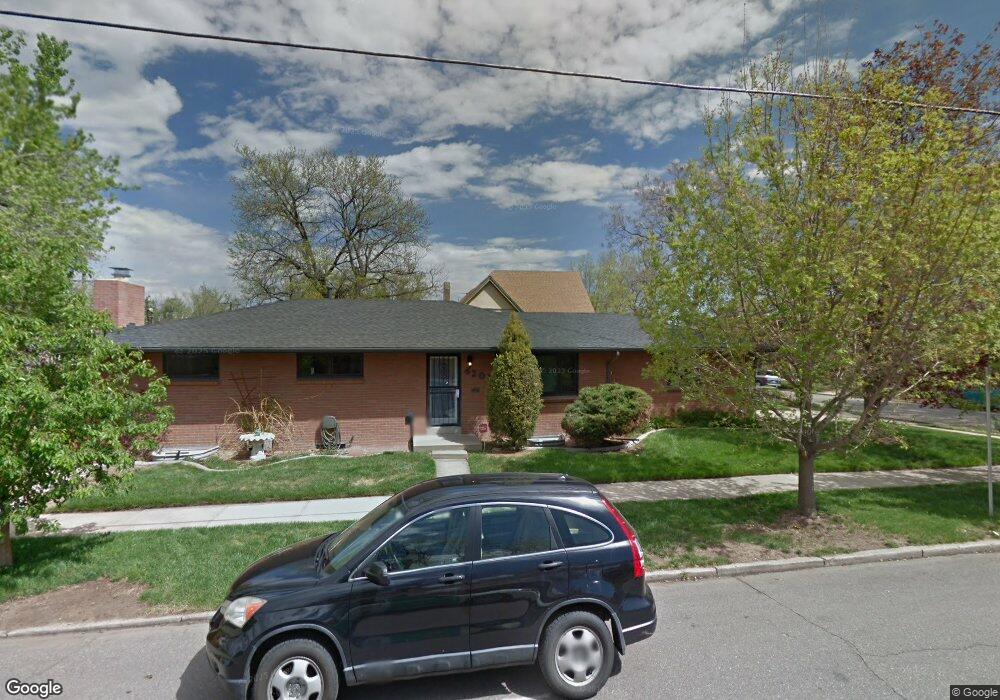
4205 W 45th Ave Denver, CO 80212
Berkeley NeighborhoodEstimated Value: $884,000 - $946,030
4
Beds
3
Baths
2,740
Sq Ft
$331/Sq Ft
Est. Value
About This Home
This home is located at 4205 W 45th Ave, Denver, CO 80212 and is currently estimated at $907,758, approximately $331 per square foot. 4205 W 45th Ave is a home located in Denver County with nearby schools including Bryant Webster Dual Language School, Skinner Middle School, and Denver Montessori Junior/Senior High School.
Ownership History
Date
Name
Owned For
Owner Type
Purchase Details
Closed on
Nov 2, 2009
Sold by
Toscan Vincent J and Toscan Lorraine
Bought by
Stuart Bullock Shelley P
Current Estimated Value
Home Financials for this Owner
Home Financials are based on the most recent Mortgage that was taken out on this home.
Original Mortgage
$252,000
Interest Rate
4.5%
Mortgage Type
Seller Take Back
Purchase Details
Closed on
May 28, 1996
Sold by
Chisman Charles Dale
Bought by
Toscan Vincent J and Toscan Lorraine M
Home Financials for this Owner
Home Financials are based on the most recent Mortgage that was taken out on this home.
Original Mortgage
$130,000
Interest Rate
7.93%
Purchase Details
Closed on
May 13, 1996
Sold by
Kosednar John H and Chisman Marzee
Bought by
Chisman Charles Dale
Home Financials for this Owner
Home Financials are based on the most recent Mortgage that was taken out on this home.
Original Mortgage
$130,000
Interest Rate
7.93%
Create a Home Valuation Report for This Property
The Home Valuation Report is an in-depth analysis detailing your home's value as well as a comparison with similar homes in the area
Home Values in the Area
Average Home Value in this Area
Purchase History
| Date | Buyer | Sale Price | Title Company |
|---|---|---|---|
| Stuart Bullock Shelley P | $337,000 | Land Title Guarantee Company | |
| Toscan Vincent J | $144,500 | Land Title | |
| Chisman Charles Dale | -- | -- |
Source: Public Records
Mortgage History
| Date | Status | Borrower | Loan Amount |
|---|---|---|---|
| Closed | Stuart Bullock Shelley P | $252,000 | |
| Previous Owner | Toscan Vincent J | $130,000 |
Source: Public Records
Tax History Compared to Growth
Tax History
| Year | Tax Paid | Tax Assessment Tax Assessment Total Assessment is a certain percentage of the fair market value that is determined by local assessors to be the total taxable value of land and additions on the property. | Land | Improvement |
|---|---|---|---|---|
| 2024 | $5,180 | $65,400 | $65,330 | $70 |
| 2023 | $5,068 | $65,400 | $65,330 | $70 |
| 2022 | $4,181 | $52,580 | $46,020 | $6,560 |
| 2021 | $4,036 | $54,090 | $47,340 | $6,750 |
| 2020 | $3,132 | $42,210 | $42,090 | $120 |
| 2019 | $3,044 | $42,210 | $42,090 | $120 |
| 2018 | $2,785 | $36,000 | $30,460 | $5,540 |
| 2017 | $2,777 | $36,000 | $30,460 | $5,540 |
| 2016 | $2,457 | $30,130 | $27,820 | $2,310 |
| 2015 | $2,354 | $30,130 | $27,820 | $2,310 |
| 2014 | $2,040 | $24,560 | $17,568 | $6,992 |
Source: Public Records
Map
Nearby Homes
- 4481 Raleigh St
- 4515 Stuart St
- 4509 Stuart St
- 4509 Stuart St Unit 25
- 4535 Stuart St
- 4452 Stuart St
- 4570 N Raleigh St
- 4557 Stuart St
- 4405 W 45th Ave
- 4415 W 45th Ave
- 4429 W 45th Ave
- 4515 Tennyson St
- 4519 Tennyson St
- 4445 W 45th Ave
- 4512 Utica St
- 4474 Utica St
- 4476 Utica St
- 4495 Utica St
- 4426 Utica St
- 4545 Utica St
- 4515 Raleigh St
- 4521 Raleigh St
- 4525 Raleigh St
- 4200 W 45th Ave
- 4204 W 45th Ave
- 4500 Raleigh St
- 4527 Raleigh St
- 4504 Raleigh St
- 4481 N Raleigh St
- 4531 Raleigh St
- 4516 Stuart St
- 4490 N Raleigh St
- 4490 Raleigh St
- 4514 Stuart St
- 4490 Stuart St
- 4477 Raleigh St
- 4526 Stuart St
- 4494 Stuart St
- 4535 Raleigh St
- 4518 Stuart St