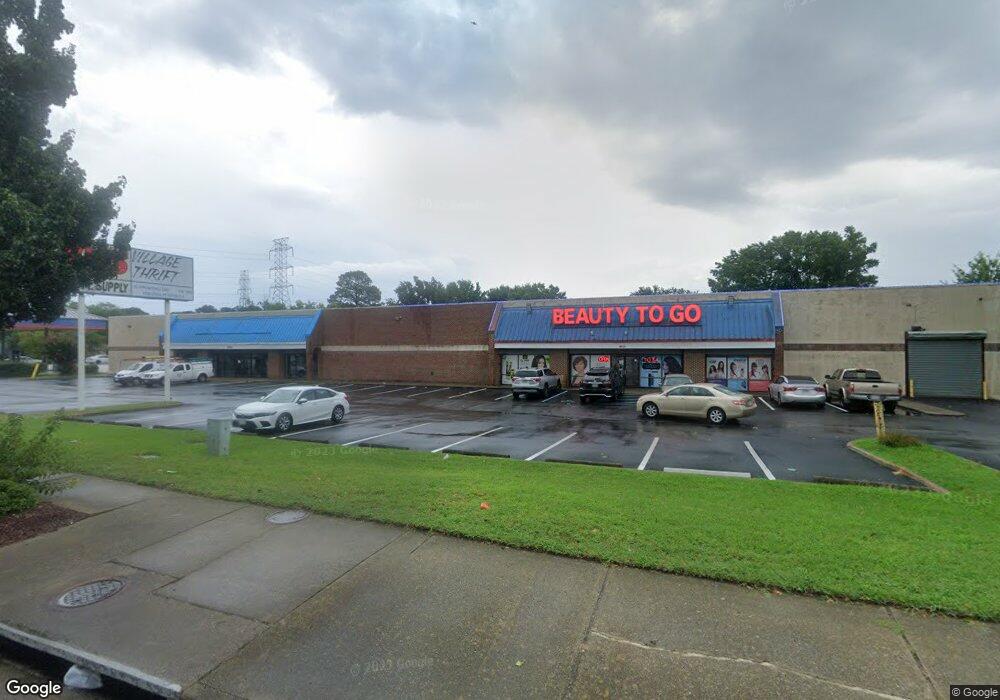
4205 W Mercury Blvd Hampton, VA 23666
Briarfield NeighborhoodEstimated Value: $2,548,749
Studio
--
Bath
28,080
Sq Ft
$91/Sq Ft
Est. Value
About This Home
This home is located at 4205 W Mercury Blvd, Hampton, VA 23666 and is currently estimated at $2,548,749, approximately $90 per square foot. 4205 W Mercury Blvd is a home located in Hampton City with nearby schools including Forrest Elementary School, Cesar Tarrant Middle School, and Bethel High School.
Ownership History
Date
Name
Owned For
Owner Type
Purchase Details
Closed on
Jul 12, 2007
Sold by
Baklayan Vicken
Bought by
4205A Mercury L L C and 4205B Mercury L L C,
Current Estimated Value
Home Financials for this Owner
Home Financials are based on the most recent Mortgage that was taken out on this home.
Original Mortgage
$1,231,000
Outstanding Balance
$771,022
Interest Rate
6.54%
Mortgage Type
Commercial
Estimated Equity
$1,777,727
Purchase Details
Closed on
Dec 21, 2001
Sold by
American Fidelity Assuran
Bought by
Baklayan Vicken
Create a Home Valuation Report for This Property
The Home Valuation Report is an in-depth analysis detailing your home's value as well as a comparison with similar homes in the area
Home Values in the Area
Average Home Value in this Area
Purchase History
| Date | Buyer | Sale Price | Title Company |
|---|---|---|---|
| 4205A Mercury L L C | $1,641,750 | -- | |
| Baklayan Vicken | $765,000 | -- |
Source: Public Records
Mortgage History
| Date | Status | Borrower | Loan Amount |
|---|---|---|---|
| Open | 4205A Mercury L L C | $1,231,000 |
Source: Public Records
Tax History
| Year | Tax Paid | Tax Assessment Tax Assessment Total Assessment is a certain percentage of the fair market value that is determined by local assessors to be the total taxable value of land and additions on the property. | Land | Improvement |
|---|---|---|---|---|
| 2025 | $20,917 | $1,492,600 | $737,700 | $754,900 |
| 2024 | $16,828 | $1,463,300 | $737,700 | $725,600 |
| 2023 | $16,974 | $1,463,300 | $737,700 | $725,600 |
| 2022 | $16,512 | $1,399,300 | $670,600 | $728,700 |
| 2021 | $22,090 | $1,498,500 | $670,600 | $827,900 |
| 2020 | $18,581 | $1,498,500 | $670,600 | $827,900 |
| 2019 | $17,469 | $1,408,800 | $670,600 | $738,200 |
| 2018 | $19,916 | $1,408,800 | $670,600 | $738,200 |
| 2017 | $20,006 | $0 | $0 | $0 |
| 2016 | $19,826 | $1,394,300 | $0 | $0 |
| 2015 | $19,826 | $0 | $0 | $0 |
| 2014 | $19,568 | $1,395,400 | $670,300 | $725,100 |
Source: Public Records
Map
Nearby Homes
- 4 Covenant Ct
- 4817 81st St
- 377 Kinsmen Way
- 233 Martha Lee Dr
- 1207 77th St
- 223 Martha Lee Dr
- 344 Brout Dr
- 4902 Hazelwood Rd
- 8415 Orcutt Ave
- 1123 75th St
- 377 Whealton Rd
- 3422 Candlewood Dr
- 1320 76th St
- 8513 Orcutt Ave
- 3403 W Weaver Rd
- 1009 72nd St
- 3328 Candlewood Dr
- 5106 Hazelwood Rd
- 3325 Greenwood Dr
- 633 Brewer St
Your Personal Tour Guide
Ask me questions while you tour the home.