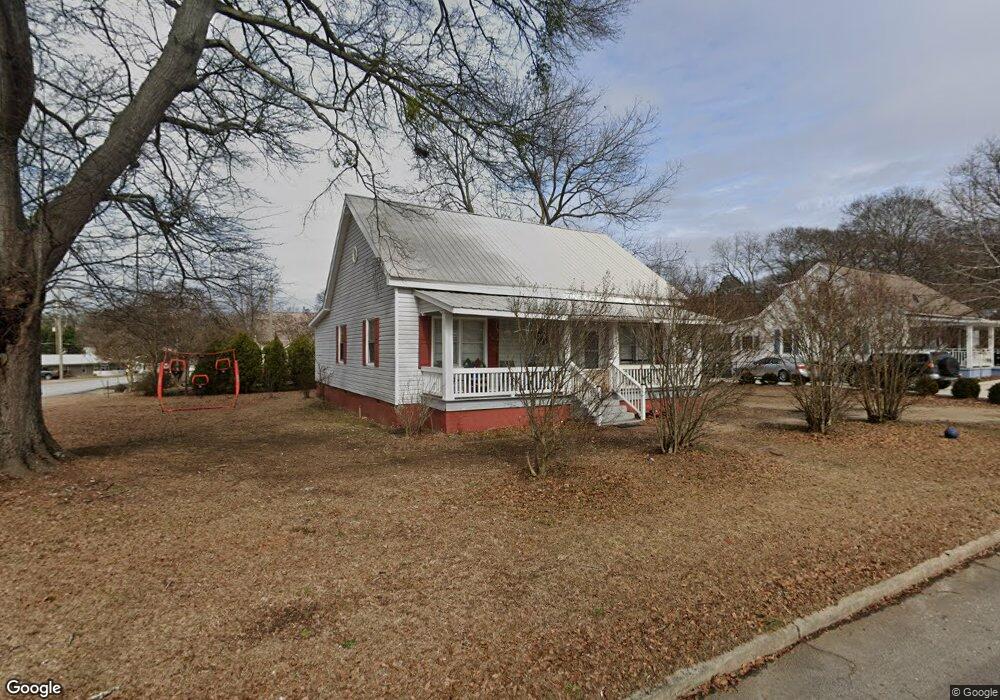
4205 Wheat St NE Covington, GA 30014
Estimated Value: $205,000 - $262,000
--
Bed
1
Bath
1,068
Sq Ft
$215/Sq Ft
Est. Value
About This Home
This home is located at 4205 Wheat St NE, Covington, GA 30014 and is currently estimated at $230,080, approximately $215 per square foot. 4205 Wheat St NE is a home located in Newton County with nearby schools including Flint Hill Elementary School, Cousins Middle School, and Eastside High School.
Ownership History
Date
Name
Owned For
Owner Type
Purchase Details
Closed on
Jun 11, 2025
Sold by
Strauss John L
Bought by
Strauss Teresa J
Current Estimated Value
Purchase Details
Closed on
Jun 4, 2009
Sold by
Hud-Housing Of Urban Dev
Bought by
Strauss John L and Strauss Teresa J
Home Financials for this Owner
Home Financials are based on the most recent Mortgage that was taken out on this home.
Original Mortgage
$78,750
Interest Rate
4.8%
Mortgage Type
New Conventional
Purchase Details
Closed on
Aug 5, 2008
Sold by
Taylor Bean & Whitaker Mtg Cor
Bought by
Hud-Housing Of Urban Dev
Purchase Details
Closed on
Jan 17, 2007
Sold by
Hicks John D
Bought by
Hilland Cristopher L
Home Financials for this Owner
Home Financials are based on the most recent Mortgage that was taken out on this home.
Original Mortgage
$94,024
Interest Rate
6.05%
Mortgage Type
New Conventional
Create a Home Valuation Report for This Property
The Home Valuation Report is an in-depth analysis detailing your home's value as well as a comparison with similar homes in the area
Home Values in the Area
Average Home Value in this Area
Purchase History
| Date | Buyer | Sale Price | Title Company |
|---|---|---|---|
| Strauss Teresa J | -- | -- | |
| Strauss John L | -- | -- | |
| Hud-Housing Of Urban Dev | -- | -- | |
| Taylor Bean & Whitaker Mtg Cor | $98,269 | -- | |
| Hilland Cristopher L | $95,500 | -- |
Source: Public Records
Mortgage History
| Date | Status | Borrower | Loan Amount |
|---|---|---|---|
| Previous Owner | Strauss John L | $78,750 | |
| Previous Owner | Hilland Cristopher L | $94,024 |
Source: Public Records
Tax History Compared to Growth
Tax History
| Year | Tax Paid | Tax Assessment Tax Assessment Total Assessment is a certain percentage of the fair market value that is determined by local assessors to be the total taxable value of land and additions on the property. | Land | Improvement |
|---|---|---|---|---|
| 2024 | $2,395 | $79,320 | $14,000 | $65,320 |
| 2023 | $2,155 | $66,320 | $4,000 | $62,320 |
| 2022 | $1,332 | $41,000 | $4,000 | $37,000 |
| 2021 | $1,020 | $28,080 | $4,000 | $24,080 |
| 2020 | $1,069 | $26,800 | $4,000 | $22,800 |
| 2019 | $1,118 | $27,520 | $4,000 | $23,520 |
| 2018 | $382 | $18,600 | $4,000 | $14,600 |
| 2017 | $607 | $14,760 | $2,000 | $12,760 |
| 2016 | $620 | $15,080 | $2,800 | $12,280 |
| 2015 | $683 | $16,600 | $2,000 | $14,600 |
| 2014 | $683 | $16,600 | $0 | $0 |
Source: Public Records
Map
Nearby Homes
- 5150 Wheat St NE
- 0 Highway 278 NE Unit 10595588
- 6192 Collins St NE
- 6193 Collins St NE
- 4217 Elizabeth St NE
- 4105 Rose Ln NE
- 5130 N Dearing St NE
- 2173 Anderson Ave SE
- 4128 Elizabeth St NE
- 5139 West Dr NE
- 4181 A&B Floyd St NE
- 6127 Floyd St NE
- 3112 Floyd St NE
- 3127 Mill St SE
- 6104 Floyd St NE
- 3149 Thompson Ave SE
- 5118 Floyd St NE
- 2133 Thompson Ave SE
- 3183 Conyers St SE
- 2173 Conyers St SE
- 5104 Mill St NE
- 5103 Wheat St NE
- 5114 Baxter St NE
- 5122 Baxter St NE
- 5117 Wheat St NE
- 5113 Mill St NE
- 5118 Mill St NE
- 5132 Baxter St NE
- 5119 Mill St NE
- 5117 Haynes Ct NE
- 5128 Mill St NE
- 5131 Wheat St NE
- 5144 Baxter St NE
- 5113 Haynes Ct NE
- 2511 Highway 278 NE
- 5104 Anglin St NE
- 0 Haynes Ct NE Unit 7344656
- 5134 Wheat St NE
- 5109 Haynes Ct NE
- 5148 Mill St NE