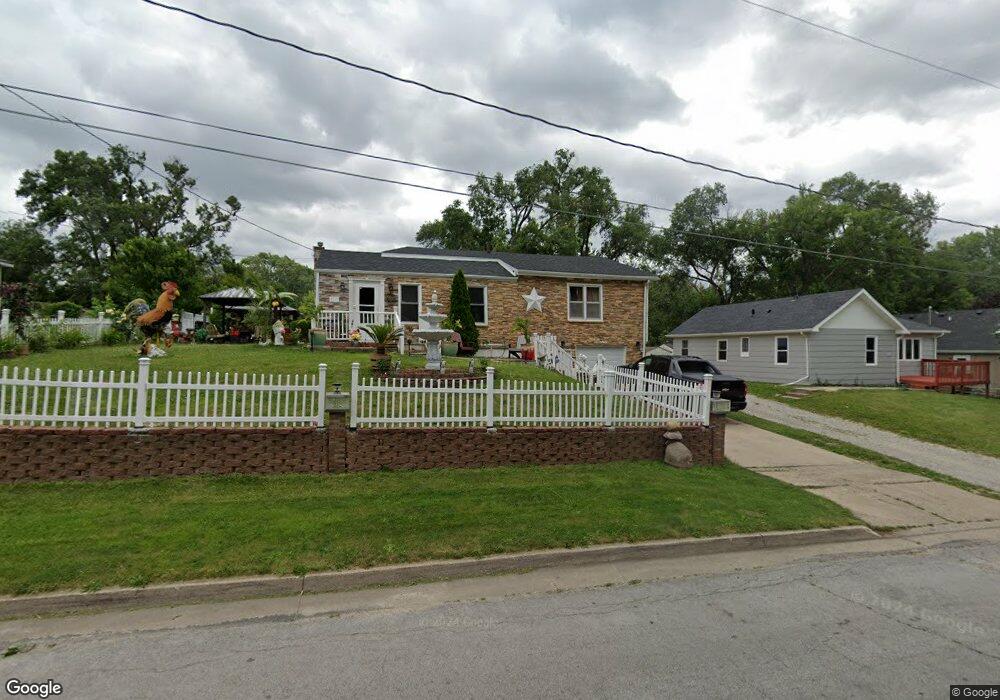
4207 SE 8th St Des Moines, IA 50315
South Central DSM NeighborhoodEstimated Value: $188,000 - $209,000
2
Beds
1
Bath
1,260
Sq Ft
$158/Sq Ft
Est. Value
About This Home
This home is located at 4207 SE 8th St, Des Moines, IA 50315 and is currently estimated at $198,614, approximately $157 per square foot. 4207 SE 8th St is a home located in Polk County with nearby schools including Lovejoy Elementary School, Weeks Middle School, and Lincoln High School.
Ownership History
Date
Name
Owned For
Owner Type
Purchase Details
Closed on
Jul 20, 2010
Sold by
Anaya Jose Luis and Anaya Vera M
Bought by
Bankers Trust Company
Current Estimated Value
Purchase Details
Closed on
Feb 15, 2005
Sold by
Hawkeye Ankeney Bank & Trust
Bought by
Waltz Myles E and Waltz Carol M
Home Financials for this Owner
Home Financials are based on the most recent Mortgage that was taken out on this home.
Original Mortgage
$100,609
Interest Rate
5.67%
Mortgage Type
Purchase Money Mortgage
Purchase Details
Closed on
Jan 22, 2004
Sold by
Krull Eldon Jake and Krull Patricia Ann
Bought by
Gaytan Gonzalez Jose
Home Financials for this Owner
Home Financials are based on the most recent Mortgage that was taken out on this home.
Original Mortgage
$61,042
Interest Rate
5.91%
Mortgage Type
FHA
Purchase Details
Closed on
Aug 12, 2002
Sold by
Carlo Adrian and Carlo James A
Bought by
Rm Madden Construction Inc
Create a Home Valuation Report for This Property
The Home Valuation Report is an in-depth analysis detailing your home's value as well as a comparison with similar homes in the area
Home Values in the Area
Average Home Value in this Area
Purchase History
| Date | Buyer | Sale Price | Title Company |
|---|---|---|---|
| Bankers Trust Company | $114,058 | None Available | |
| Waltz Myles E | $26,000 | -- | |
| Gaytan Gonzalez Jose | $61,500 | -- | |
| Rm Madden Construction Inc | $7,000 | -- |
Source: Public Records
Mortgage History
| Date | Status | Borrower | Loan Amount |
|---|---|---|---|
| Previous Owner | Waltz Myles E | $100,609 | |
| Previous Owner | Gaytan Gonzalez Jose | $61,042 |
Source: Public Records
Tax History Compared to Growth
Tax History
| Year | Tax Paid | Tax Assessment Tax Assessment Total Assessment is a certain percentage of the fair market value that is determined by local assessors to be the total taxable value of land and additions on the property. | Land | Improvement |
|---|---|---|---|---|
| 2025 | $3,300 | $195,900 | $29,400 | $166,500 |
| 2024 | $3,300 | $178,200 | $26,300 | $151,900 |
| 2023 | $3,070 | $178,200 | $26,300 | $151,900 |
| 2022 | $3,044 | $139,100 | $21,100 | $118,000 |
| 2021 | $2,942 | $139,100 | $21,100 | $118,000 |
| 2020 | $3,052 | $126,500 | $19,200 | $107,300 |
| 2019 | $2,668 | $126,500 | $19,200 | $107,300 |
| 2018 | $2,636 | $107,800 | $16,000 | $91,800 |
| 2017 | $2,520 | $107,800 | $16,000 | $91,800 |
| 2016 | $2,450 | $101,700 | $14,900 | $86,800 |
| 2015 | $2,450 | $101,700 | $14,900 | $86,800 |
| 2014 | $2,482 | $102,100 | $14,600 | $87,500 |
Source: Public Records
Map
Nearby Homes
- 705 E Watrous Ave
- 1201 E Philip St
- 3909 SE 5th St
- 448 Scandia Ave
- 3616 SE 11th St
- 409 Wilmers Ave
- 401 E Mckinley Ave
- 4316 SE 4th St
- 904 E Hackley Ave
- 712 E Hackley Ave
- 801 E Hackley Ave
- 209 E Philip St
- 311 E Emma Ave
- 5205 SE 9th St
- 126 E Maxwelton Dr
- 118 E Watrous Ave
- 3303 SE 4th St
- 108 E Philip St
- 1600 Evergreen Ave
- 1617 Evergreen Ave
- 4201 SE 8th St
- 4213 SE 8th St
- 4121 SE 8th St
- 4219 SE 8th St
- 4210 SE 10th St
- 4216 SE 10th St
- 4200 SE 10th St
- 4300 SE 10th St
- 4301 SE 8th St
- 4115 SE 8th St
- 4116 SE 10th St
- 4206 SE 8th St
- 4212 SE 8th St
- 4200 SE 8th St
- 4308 SE 10th St
- 4218 SE 8th St
- 4120 SE 8th St
- 4305 SE 8th St
- 4109 SE 8th St
- 4110 SE 10th St