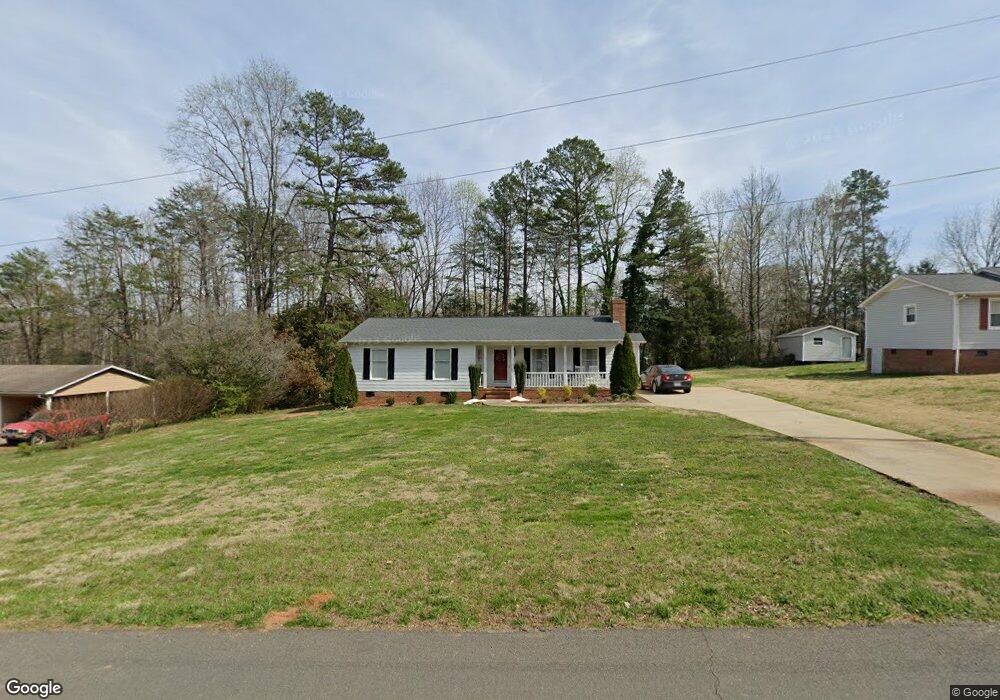
4208 Wrentree Dr Dallas, NC 28034
Estimated Value: $257,841 - $292,000
3
Beds
2
Baths
1,300
Sq Ft
$209/Sq Ft
Est. Value
About This Home
This home is located at 4208 Wrentree Dr, Dallas, NC 28034 and is currently estimated at $271,210, approximately $208 per square foot. 4208 Wrentree Dr is a home located in Gaston County with nearby schools including Costner Elementary School, W.C. Friday Middle School, and North Gaston High School.
Ownership History
Date
Name
Owned For
Owner Type
Purchase Details
Closed on
Jul 13, 2012
Sold by
Secretary Of Housing & Urban Development
Bought by
Byrd Louena
Current Estimated Value
Home Financials for this Owner
Home Financials are based on the most recent Mortgage that was taken out on this home.
Original Mortgage
$50,875
Outstanding Balance
$35,449
Interest Rate
3.87%
Mortgage Type
FHA
Estimated Equity
$235,761
Purchase Details
Closed on
Mar 16, 2012
Sold by
Caldwell Terry B and Caldwell Lori M
Bought by
Secretary Of Housing & Urban Development
Purchase Details
Closed on
Oct 29, 2007
Sold by
Lincoln Investment Co
Bought by
Caldwell Terry B
Home Financials for this Owner
Home Financials are based on the most recent Mortgage that was taken out on this home.
Original Mortgage
$119,130
Interest Rate
6.27%
Mortgage Type
FHA
Purchase Details
Closed on
May 10, 2007
Sold by
Rowland John J and Oates Beverly M
Bought by
Lincoln Investment Co
Create a Home Valuation Report for This Property
The Home Valuation Report is an in-depth analysis detailing your home's value as well as a comparison with similar homes in the area
Home Values in the Area
Average Home Value in this Area
Purchase History
| Date | Buyer | Sale Price | Title Company |
|---|---|---|---|
| Byrd Louena | -- | None Available | |
| Secretary Of Housing & Urban Development | $135,425 | None Available | |
| Caldwell Terry B | $121,000 | None Available | |
| Lincoln Investment Co | $69,352 | None Available |
Source: Public Records
Mortgage History
| Date | Status | Borrower | Loan Amount |
|---|---|---|---|
| Open | Byrd Louena | $50,875 | |
| Previous Owner | Caldwell Terry B | $119,130 |
Source: Public Records
Tax History Compared to Growth
Tax History
| Year | Tax Paid | Tax Assessment Tax Assessment Total Assessment is a certain percentage of the fair market value that is determined by local assessors to be the total taxable value of land and additions on the property. | Land | Improvement |
|---|---|---|---|---|
| 2025 | $732 | $204,910 | $22,500 | $182,410 |
| 2024 | $732 | $204,910 | $22,500 | $182,410 |
| 2023 | $712 | $204,910 | $22,500 | $182,410 |
| 2022 | $580 | $126,160 | $18,000 | $108,160 |
| 2021 | $594 | $126,160 | $18,000 | $108,160 |
| 2019 | $588 | $126,160 | $18,000 | $108,160 |
| 2018 | $462 | $109,566 | $18,000 | $91,566 |
| 2017 | $462 | $109,566 | $18,000 | $91,566 |
| 2016 | $464 | $109,566 | $0 | $0 |
| 2014 | -- | $115,527 | $22,500 | $93,027 |
Source: Public Records
Map
Nearby Homes
- TBD Miles Rd
- 554 Loray Farm Rd
- 320 Huffstetler Lake Rd
- 4618 Dallas High Shoals Hwy
- 3501 Cinderella Dr Unit 7
- 3514 Merry Oaks Ln
- 3508 Merry Oaks Ln
- 1274 Carpenter Springs Dr
- 4148 Puetts Chapel Rd
- 4136 Puetts Chapel Rd
- 236 Mark Ryan Ln
- Tbd Miles Rd Unit LotWP001
- 1819 Ratchford Dr
- 848 Ike Lynch Rd
- 265 Bob Friday Rd
- 263 Bob Friday Rd
- 00 Starlight Dr
- 233 Starlight Dr
- 1349 High Shoals Rd
- 541 Old Nc 277 Rd
- 4206 Wrentree Dr
- 4210 Wrentree Dr
- 4205 Wrentree Dr
- 4204 Wrentree Dr
- 4207 Wrentree Dr
- 4203 Wrentree Dr
- 4202 Wrentree Dr
- 4201 Wrentree Dr
- 4203 Springview Dr
- 4205 Springview Dr
- 4207 Springview Dr
- 0 Wrentree Dr Unit 3105959
- 4107 Wrentree Dr
- 000 Adrians Forest Dr
- 0 Adrians Forest Dr
- 00 Adrians Forest Dr
- 4106 Wrentree Dr
- 4202 Wimbledon Dr
- 4110 Wimbledon Dr
- 4108 Wimbledon Dr